

1.1 Anatomy
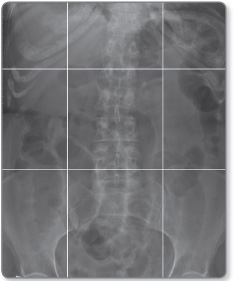
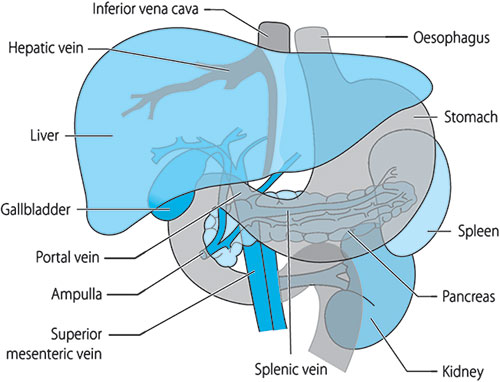
For convenience the abdominal cavity is divided into nine segments (Figure 1.1). These regions can be demarcated on an abdominal radiograph by drawing a horizontal line through the 9th ribs and the pelvic brim, and two vertical lines from the centre of the costal cartilage of the 9th rib to the middle of the inguinal ligament. The organs (Figure 1.2) contained in these segments are as follows:
- Right hypochondrium: gallbladder, right lobe of liver, duodenum, hepatic flexure of colon, upper pole of right kidney and pancreatic head
- Epigastrium: stomach, pancreatic body, left lobe of liver
- Left hypochondrium: spleen, splenic flexure of colon, and upper pole of left kidney
- Right lumbar region: ascending colon and right kidney
- Umbilical region: transverse colon, greater omentum and small bowel
- Left lumbar region: descending colon and left kidney
- Right iliac fossa: caecum, terminal ileum, appendix and ureter
- Hypogastrium: small intestine, bladder and gravid uterus
- Left iliac fossa: sigmoid colon, ureter and small bowel.

Abdominal organs
Liver
The liver is the largest organ in the abdomen and consists of a right and a left lobe, divided by the longitudinal fissure, which is seen as a notch in the liver contour (Figure 1.3). On radiographs, the liver is seen as a triangular structure on the right; its undersurface may be outlined by fat and is visible across the right hypochondrium or lumbar region. On cross-sectional imaging the liver is seen on the right. If intravenous contrast is used, the blood vessels appear of higher signal density than the liver parenchyma.3

Figure 1.3: CT scan showing the falciform ligament (arrow) dividing the liver into Ⓡ the larger right lobe and Ⓛ smaller left lobe.
Lobes of the liver The right lobe is much larger than the left, though this morphology may be reversed in certain pathologies such as cirrhosis, where the right lobe atrophies and appears to be of similar size or smaller than the left lobe. Between 4% and 14% of the population have a prominent inferior extension of the right lower lobe, known as Riedel's lobe. This lobe usually extends caudally below the iliac crest.
Two smaller lobes are associated with the right lobe: the quadrate lobe (Latin = square), which is next to the gallbladder bed and the caudate lobe (Latin = tail), which is adjacent to the inferior vena cava (IVC) as it crosses the liver. The normal liver measures up to 13 cm in the midclavicular line (a bilateral vertical line from the middle of the clavicle down the thorax).
Blood supply The liver derives its blood supply from two sources: the hepatic artery and the portal vein.
- The hepatic artery is a branch of the coeliac trunk, which arises from the aorta at the level of the T12 vertebra.Occasionally the hepatic artery may arise from the superior mesenteric artery.
- The portal vein is formed by the confluence of the splenic vein and the superior mesenteric vein behind the head of pancreas (Figure 1.4), and is responsible for 75% of the blood supply to the liver.
This vascular arrangement is physiologically important for radiological imaging. As the portal system is responsible for most of the hepatic blood circulation, imaging of the liver is performed at approximately 60 seconds after contrast injection because this is the amount of time needed for the contrast to pass through the aorta and splanchnic circulation to reach the portal vein (Figure 1.5). Primary tumours of the liver are predominantly supplied by the hepatic artery and therefore enhance in the arterial phase, so, to assess the arterial circulation, imaging is done at 30 seconds, when the hepatic artery shows enhancement.
Portal vein velocity and haemodynamics can also be studied on Doppler scans. In the normal state, normal respiratory variation in portal flow is observed, whereas, in diseased states, the variation is often lost and there may be increased/decreased velocity in the portal vein.

Figure 1.4: Coronal MRI of the liver showing superior mesenteric and splenic veins (arrows) joining to form the portal vein (arrowhead). The portal vein branches are seen within the liver.

Figure 1.5: Axial MRI at the porta hepatis (hilum of the liver) showing the relationship of the portal vein (arrow) posterior to the hepatic artery (arrowhead) and bile duct (curved arrow).
The venous drainage of the liver is through the hepatic veins into the IVC; these veins can be accessed though the IVC via the jugular or femoral veins for angiography, liver biopsies and hepatic venous pressure measurements.
Pancreas
The pancreas consists of a head, body and tail and is situated transversely across the posterior wall of the abdomen, with its body at the level of T12 (Figure 1.6). The head of the pancreas is curved on itself and located along the concavity of the second and third parts of the duodenum. The body of the pancreas is covered anteriorly by layers of the transverse mesocolon and posterior surface of the stomach. Therefore inflammation of the pancreas can involve the colon via the mesocolon and the stomach bed. The pancreas is supplied by the pancreaticoduodenal branch of the hepatic artery and branches from the splenic arteries. Its venous drainage is into the splenic and superior mesenteric veins.6

Figure 1.6: Axial section at T12 level showing liver, pancreas, gallblader, kidneys, aorta and inferior vena cava.
Gallbladder
The gallbladder is a pear-shaped structure located on the undersurface of the liver, consisting of a fundus, body and neck. It is a storage organ for bile produced by the liver, and drains via the cystic duct into the common hepatic duct to form the common bile duct (CBD). The common hepatic duct is formed by the union of the right and left hepatic ducts (Figure 1.7). The CBD joins the pancreatic ducts and opens at the duodenal ampulla. It lies to the right of the hepatic artery and in front of the portal vein as it descends to open out at the ampulla.
Spleen
The spleen is an oblong organ located in the left hypochondrium beneath the left 10th rib and hemidiaphragm posterolateral to the gastric fundus (Figure 1.8). It is attached to the stomach by the gastrosplenic ligaments, which contain the vascular supply consisting of the splenic artery and veins. The spleen is usually <12 cm in length in an adult, and the splenic vein measures up to 1 cm in diameter. The most inferior surface of the spleen abuts the phrenicocolic ligament, a peritoneal fold that marks the anatomical splenic flexure of the colon.7


Figure 1.8: Axial section at L2 level showing liver, head of pancreas, kidneys, aorta, inferior vena cava, superior mesenteric vessels and spleen.
Kidneys
The kidneys are located at the posterior wall of the abdomen in the retroperitoneal region. They extend from approximately the 11th rib to the iliac crests. The right kidney is located slightly lower than the left due to the large size of the liver. The external or lateral border is convex, whereas the internal border is concave, and contains a deep notch, which is known at the hilum of the kidney (Figure 1.9). The renal vessels, nerves and uterus enter the kidney at the hilum.
The adult kidney varies in length between 8 and 12 cm. The arterial supply is via the renal arteries that arise from the aorta. Each renal artery divides into four or five branches on entering the hilum. The ureters run downwards from the hilum to the bladder and in their course rest on the psoas muscles. At the pelvic brim they cross the common iliac artery before entering the bladder.
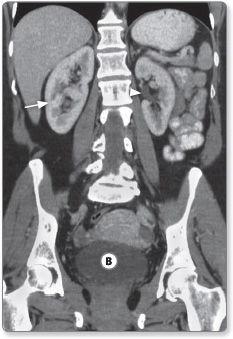
Figure 1.9: Coronal CT image showing the kidneys (arrow) and bladder Ⓑ. The hilum of the left kidneys is visible (arrowhead).
Stomach and duodenum
The stomach is situated mainly in the left hypochondrium and epigastrium (Figure 1.10). It consists of the fundus, body and antrum. The distal-most part of the stomach is the pyloric canal, which communicates with the first part of the duodenum. The lesser curvature of the stomach extends from the oesophageal to the pyloric orifice, along the upper border of the organ, and is attached to the undersurface of the liver via the lesser omentum; the greater curvature is along the outer border and gives attachment to the deep greater omentum. The stomach is supplied by the right gastroepiploic branches of the hepatic and the left gastroepiploic branches of the splenic arteries.
Small intestine
At between 3 and 7 metres, the adult small intestine consists of:
- approximately 26 cm of duodenum (Latin for 12, i.e. its length in fingerwidths),
- 2.5 m of jejunum (Latin: fasting, as it is found empty at death) and
- 2–4 m of ileum (Latin: flank).
The small intestine is coiled centrally, with the shorter colon framing it as it extends clockwise around the abdomen (Figure 1.11).


Duodenum The duodenum is the shortest and widest part of the small intestine, has no mesenteric attachment and is mostly retroperitoneal.
It consists of four parts (D1–D4):
- D1 (the duodenal cap) communicates with the pylorus
- D2 is vertical and retroperitoneal, passing downward in front of the right kidney to the level of L3. It is into this second section that the common and pancreatic ducts empty
- D3 is horizontal in orientation and crosses the front of the spine, in front of the aorta and IVC
- D4 emerges from the retroperitoneum and joins the jejunum at the level of L1–2.
Jejunum and ileum The jejunum is generally wider than the ileum and contains numerous mucosal folds. The narrower ileum also has many folds and villi for its absorption function, and occupies the hypogastric and right iliac regions. In terms of vasculature, branches of the coeliac artery supply the stomach 11and duodenum, whereas the superior mesenteric artery supplies the rest of the small intestine, as well as the colon up to the splenic flexure.
Colon
The colon starts at the caecum, where it communicates with the terminal ileum via the ileocaecal valve, and extends clockwise 1.5 m around the abdomen to the rectum. The colon is larger in diameter and more fixed in position than the small intestine, and has characteristic small pouches, called ‘haustra’, caused by sacculations (folding) of the colonic wall. The caecum is located in the right iliac fossa (Figure 1.12). The ileocaecal valve is usually on the posteromedial wall of the caecum, and the appendix approximately 2 cm below the valve.
The ascending colon is located along the right flank and continues as the transverse colon, which crosses the abdomen and then descends along the left lumbar region to the left iliac fossa.
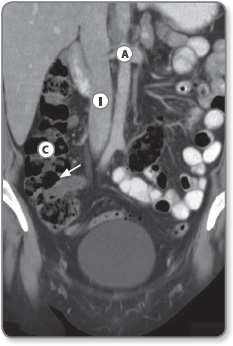
Figure 1.12: Coronal CT image showing the ascending colon Ⓒ and the ileocaecal junction (arrow). The aorta Ⓐ and inferior vena cava Ⓘ are seen in the midline along with small bowel loops in the left side Ⓛ of the abdomen.
The ascending and descending portions of the colon are retroperitoneal and therefore fixed in position. Conversely, the transverse colon, caecum and sigmoid colon are attached to their respective mesocolon (a double layer of peritoneum) and hang freely within the abdominal cavity. Therefore, these segments may be tortuous or mobile. At the left iliac fossa the colon becomes more tortuous as it forms the sigmoid colon. It enters the pelvis and descends along the posterior wall and presacral space, to form the rectum and anal canal.
The blood supply of the colon distal to the splenic flexure is via the inferior mesenteric artery. The rectum also gets blood supply from the superior and inferior rectal arteries of the iliac blood vessels.
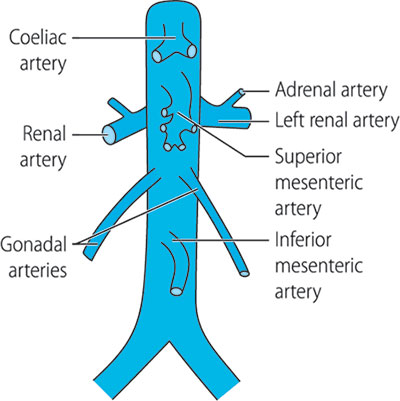
Abdominal vasculature
The abdominal aorta starts at the diaphragmatic opening at the level of the T12 vertebral. It usually descends slightly to the left of the vertebral column and terminates at the level of L4 where it divides into the two common iliac arteries (Figure 1.13). The major visceral branches of the aorta are the coeliac axis, superior and inferior mesenteric arteries, suprarenal arteries, renal arteries and spermatic arteries. Parietal branches (parietal = relating to the walls of a part or cavity) are the phrenic, lumbar and sacral arteries.
1.2 Imaging modalities
Radiographs
Radiographs are formed by X-rays passing through the body and forming a latent image on the film or sensor placed behind. Different tissues of the body absorb different amounts of X-ray photons, producing different densities on the image – a ‘shadow’ of tissues. Bones absorb most of the X-ray photons because they have a higher electron density than soft tissues. When the film is developed, the parts of the image corresponding to higher X-ray exposure are dark, leaving a white shadow of bones on the film.
X-rays are widely used in medicine for producing images of the body and also for certain treatments (radiotherapy). Their beneficial use must always be weighed against the potential harm they cause as a form of ionising radiation, which can lead to cellular destruction and mutations in DNA. The biological effect of radiation on human tissue is measured as the equivalent dose and expressed in sieverts (symbol: Sv). In general, routine radiographs do not impart significant radiation dose; however, CT, nuclear and interventional examinations impart significant radiation to patients, so these high radiation dose examinations are performed only after due justification and their perceived benefit over risk to the patient (Table 1.1).
Use of contrast agents
Several other techniques are used to enhance the normal X-ray examination. For example, injection of iodine-containing intravenous contrast can delineate the vasculature (iodine, being dense, outlines the blood vessels against the soft tissues). This technique is known as angiography (Figure 1.14).14
Injection of contrast and acquisition of images after a delay of 5–30 min allow delineation of the urinary system as the kidneys excrete the iodinated contrast. This examination is termed ‘intravenous urography’ (IVU) (Figure 1.15).
The gastrointestinal (GI) tract can be delineated by using barium sulphate solution. Barium, as a dense, inert, metallic ion, outlines the GI tract on radiographs. These procedures are called barium swallow (oesophagus), barium follow-through (small intestine) and barium enema (colon) examinations (Figure 1.16).
Fluoroscopy
Fluoroscopy is another technique in which X-rays are used to image the body in real time. In this type of examination, continuous X-ray exposure of the body (e.g. 2 frames/s or more) produces a cine image.15

Figure 1.14: Angiogram of the superior mesenteric artery after injection of dye through a transfermoral catheter shows its jejunal and ileal branches. The ileocolic branch is marked (arrow).
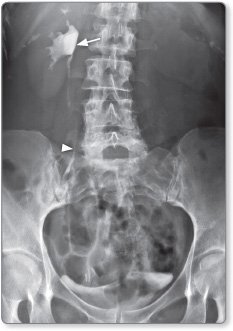
Figure 1.15: IVU image taken at 10 minutes demonstrating the renal calyces (arrow) and ureter (arrowhead) outlined by iodinated contrast. Note the patient has only a single kidney.
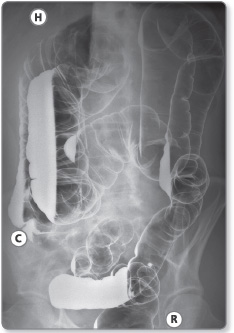
Figure 1.16: Abdominal radiograph after a barium enema (instillation of barium per rectum) showing the colon in its entirety. Ⓗ hepatic flexure, Ⓒ caecum, Ⓡ rectum.
For example, fluoroscopy may be used in assessing peristalsis of the bowel on a barium follow-through examination or the swallowing mechanism in a barium swallow examination. Fluoroscopy is also particularly useful in guiding interventional procedures such as biopsies and drainages.
Computed tomography
Intravenous and oral contrast are usually administered during abdominal CT examinations to delineate the GI tract and vasculature. Intravenous contrast is particularly useful in assessing the vascularity or enhancement patterns of tumours and abnormal tissue. Intravenous contrast contains iodine, which appears hyperdense on CT images so blood vessels appear dense. Recent advances in CT technology allow scans to be acquired within seconds and powerful software allows detailed three-dimensional images of the body.17
The main clinical indications for CT is in the setting of acute abdominal presentations (e.g. trauma, bowel obstruction, renal colic), cancer staging and diagnosis, follow-up imaging of cancer after treatment to assess response and during guidance for biopsy or drainages.
Ultrasound
Ultrasound (US) uses high-frequency sound waves (>2 mHz) to visualise body tissues with real-time sonographic images. It was originally developed from military SONAR technology used in the navy, and is now one of the most widely used diagnostic tools.
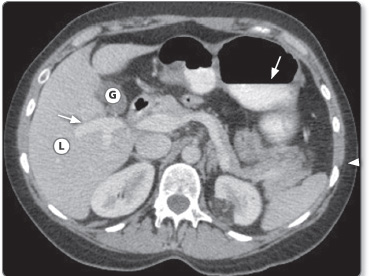
Figure 1.17: CT image of the abdomen showing different contrast densities and accurate anatomical delineation of abdominal organs. L = Liver; G= Gallbladder. Iodinated contrast in the portal vein and in stomach (arrows).
A handheld transducer (probe) emits high frequency sound waves (above 20 kHz) that are reflected to varying degrees by the body tissues. These reflected echoes are sensed by the same probe and used to create the image. Dense tissues and material reflect more soundwaves (hyperechoic) and hence appear light (Figure 1.18). Conversely, fluid and air reflect less (hypoechoic) and transmit more of the soundwaves and appear dark. The advantages of US include its lack of radiation and the ability to visualise tissue in real time.
Doppler imaging
US examinations can be supplemented with Doppler scans that assess blood flow in body tissues (Figure 1.19). Doppler imaging uses the physical principle of the Doppler effect to assess whether blood is moving towards or away from the probe, and its relative velocity.

Figure 1.18: US image of the right upper quadrant showing the moderate reflectivity of the liver (arrow).ⓛ inferior vena cava, Ⓐaorta are labelled.
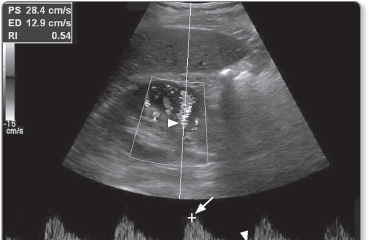
Figure 1.19: Doppler scan of the renal artery showing normal flow. The cursor for Doppler measurement has been placed on the renal artery (arrowhead). Trace shows peak systolic flow (long arrow) and end diastolic flow (short arrow) values.
By convention, blood flowing towards the probe is labelled red whereas blood flowing away from it is labelled blue on US images.
Magnetic resonance imaging
First used in 1977, magnetic resonance imaging (MRI) uses the spin properties of hydrogen nuclei to generate images. It uses a powerful magnetic field to align all the hydrogen atoms in the body. Once aligned the atoms have a net longitudinal magnetic moment. A switching radiofrequency pulse is then used to disrupt this alignment. The radiofrequency pulse imparts extra energy to the atoms and they spin out of the longitudinal arrangement into a transverse orientation. Once the pulse is switched off, the hydrogen atoms again realign longitudinally to the magnetic field. In returning from a transverse to a longitudinal orientation, a rotating, diminishing magnetic field 20is created. The return of the excited nuclei from the high-energy to the low-energy state is associated with the loss of energy to the surrounding nuclei and MR images are based on the observation of this relaxation that takes place after the radiofrequency pulse has stopped.
MR images can be constructed because the protons in different tissues return to their equilibrium state at different rates. By varying imaging parameters such as TR (pulse repetition time) and TE (echo time), it is possible to produce T1- or T2-weighted images. T1 is the spin-lattice or longitudinal relaxation time, and T2 is the spin-spin or transverse relaxation time. Different tissues appear differently in both images:
- fat appears bright on T1-weighted images
- fluid appears bright on T2-weighted images (Figure 1.20).
MR scans usually take longer to acquire than CT scans, and assessing one organ (such as liver) may take 25–30 min, although MRI provides much greater contrast between the different soft tissues of the body.

Figure 1.20: MRI of the liver Ⓛ showing enhancement of the portal veins (arrow) and parenchyma. Note the bones are dark (hypointense) as they do not have many unpaired hydrogen ions to produce a signal on images.
MR images take longer to acquire because a number of different sequences are required to define anatomical detail, organ-specific sequences and sequences for highlighting specific disease processes. Each individual sequence may take about 5 min and a typical examination may use several sequences. The dynamic enhancement patterns of abdominal organs can also be assessed by using ultrafast sequences. MRI has the advantage over CT and radiographs that ionising radiation is not involved.
MRI with and without contrast agents
Intravenous contrast agents used in MRI contain gadolinium or manganese, which have paramagnetic properties. Unlike CT or US, which use only X-rays or sound waves to generate images, MRI exploits a long list of tissue properties to generate images and thus can be more tissue specific. For example, blood flow within the arteries can be used to generate angiographic images without having to use a contrast agent.
Nuclear imaging
Nuclear imaging relies on specific radionuclides that are injected into the body for production of images. A radionuclide is an atom with an unstable nucleus, which undergoes radioactive decay and in doing so produces ionising radiation such as gamma rays and subatomic particles. These emissions are detected by cameras to produce images. Radionuclides may occur naturally, but can also be artificially produced. Some commonly used radionuclides are isotopes of technetium (99mTc) and iodine (123I and 131I), thallium-201, gallium-67 and indium-111.
Nuclear imaging shows the physiological function of the system being investigated as opposed to traditional anatomical imaging such as CT or MRI. Nuclear medicine imaging studies are generally more tissue specific, e.g. 99mTc may be used to visualise bony metastases because it is taken up by metabolically active bone lesions and appears as hot spots on images.22
Positron emission tomography–CT (PET-CT) combines PET and CT to acquire images on a single superimposed image. PET is a nuclear imaging technique that produces a three-dimensional image; it uses the radioactive tracer (radionuclide) fluorodeoxyglucose (FDG) as contrast. FDG is taken up by tissues with a high metabolic rate and appears as hot spots on images (Figure 1.21). PET-CT has a very high sensitivity in the detection of metastases and tumours (the cells of which are often highly metabolic) compared with other modalities.
Interventional radiology
Abdominal interventions such as biopsies or drainages may be carried out by radiologists under imaging guidance using fluoroscopy, US, CT or MRI. These imaging modalities are typically used to guide needles or catheters into correct anatomical locations. For example US or fluoroscopy may be used to guide puncture of the bile duct in a percutaneous transhepatic cholangiogram examination (Figures 1.22 and 1.23).


Figure 1.22: (a) Percutaneous cholangiogram (PTC) showing obstruction of bile ducts at hilum (arrow). (b) A guidewire (arrows) has been manipulated through the stricture into the duodenum. (c) A metallic stent (arrow) is being deployed across the stricture.
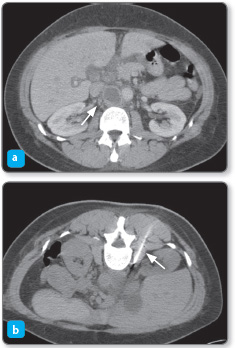
Figure 1.23: (a) CT image showing a small abscess (arrow) between the aorta and inferior vena cava. (b) Needle is seen (arrow) being introduced into the abscess for drainage under CT guidance.
Imaging is also required for more complex interventions such as placing of stents or angioplasties.