

The heart beats from the 3rd week of embryonic life until the moment of death – more than 3 billion times in a lifetime. Only the size of a fist and weighing 300 g, the heart pumps > 7000 L of blood per day through nearly 100,000 km of blood vessels.
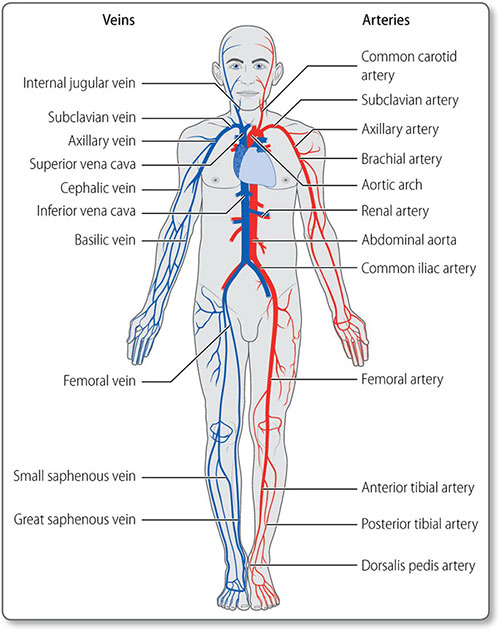
The main purpose of the cardiovascular system (Figure 1.1) is to transport substances around the body, including:
- Oxygen (O2) and nutrients (e.g. glucose, amino acids) to tissues
- Waste products [e.g. carbon dioxide (CO2), urea and lactate] from tissues
- Fluids and electrolytes
- Hormones to target organs
- White blood cells
- Clotting factors and platelets
- Heat, to aid thermoregulation.
1.1 Cardiovascular anatomy
HEART
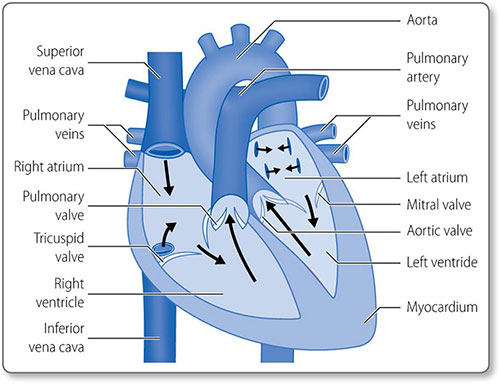
The heart is composed of muscle arranged around a framework of fibrous tissue and is the size of a fist. The two atria collect blood and fill the two ventricles, which pump blood into the pulmonary and systemic circulations (Figure 1.2). Its four valves prevent blood flow in the wrong direction.
Cardiomyocytes are the main cells of the heart (see page 28). The interstitium between them contains collagen, elastin, fibrous connective tissue, blood and lymphatic vessels.
Surface anatomy and relations
The heart is in the middle mediastinum with its apex pointing inferolaterally (Figures 1.3 and 1.4). It is posterior to the sternum, costal cartilages and left lung pleura and superior to the left diaphragm. Structures adjacent to the posterior heart 2are the thoracic vertebrae, esophagus and descending aorta (Table 1.1).

Chambers and valves
The heart has four muscular chambers, each connected to a great vessel. The four valves lie between the ventricles and atria and the ventricles and the great arteries (Figure 1.5).
Left atrium
The mitral orifice and valve separate the left atrium and ventricle. The atrium receives its blood supply from the left circumflex coronary artery. The left atrial appendage or left auricle is a muscular out-pouching continuous with the left atrium. The left and right atria are separated by the interatrial septum.
Mitral valve
The mitral valve prevents blood regurgitating back into the left atrium during systole. It has two leaflets (i.e. it is bicuspid):
- The anterior leaflet attaches to the anterior aspect of the mitral orifice
- The posterior leaflet attaches to the posterior orifice
The free edges of the leaflets are attached to the chordae tendinae, which attach to the left ventricular papillary muscles. This subvalvular apparatus prevents valve prolapse during systole.
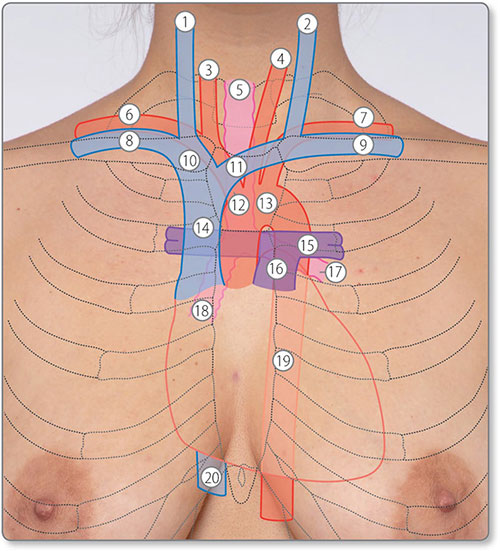
Figure 1.3: Surface anatomy of the heart and great vessels. ①, right internal jugular vein; ②, left internal jugular vein; ③, right common carotid artery; ④, left common carotid artery; ⑤, trachea; ⑥, right subclavian artery; ⑦, left subclavian artery; ⑧, right subclavian vein; ⑨, left subclavian vein; ⑩, right brachiocephalic vein; ⑪, left brachiocephalic vein; ⑫, brachiocephalic trunk; ⑬, arch of aorta; ⑭, superior vena cava; ⑮, left pulmonary artery; ⑯, pulmonary trunk; ⑰, left main bronchus; ⑱, right main bronchus; ⑲, descending aorta; ⑳, inferior vena cava.
Left ventricle
The left ventricle is an elongated inverted cone that 5is circular in cross-section (Figure 1.6). Its internal surface is heavily trabeculated by muscle fibers (Figure 1.7).
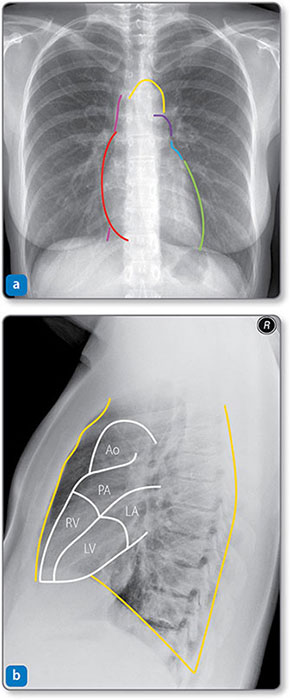
Figure 1.4: Radiographs showing the borders of the heart and great vessels. (a) Frontal view. The right heart border (red) is formed mainly by the right atrium. The left heart border is formed mainly by the left ventricle (LV, green) and the left atrium (LA, blue). The inferior surface (against the diaphragm) represents the right ventricle (RV). The vena cava (pink) is above and below the right heart border, and the aortic arch (yellow) and pulmonary trunk (purple) are above the left atrium. (b) Lateral view. The anterior, posterior and inferior relations of the heart (orange) are formed by the sternum or left lung pleura, thoracic spine and diaphragm, respectively. Ao, aorta; PA, pulmonary artery.
The mitral valve chordae tendinae attach to an anterior and posterior papillary muscle.
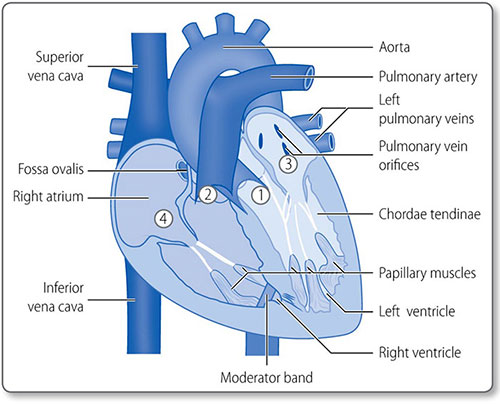
Figure 1.5: Anatomy of the heart valves. ① Aortic valve. ② Pulmonary valve. ③ Mitral valve. ④ Tricuspid valve.

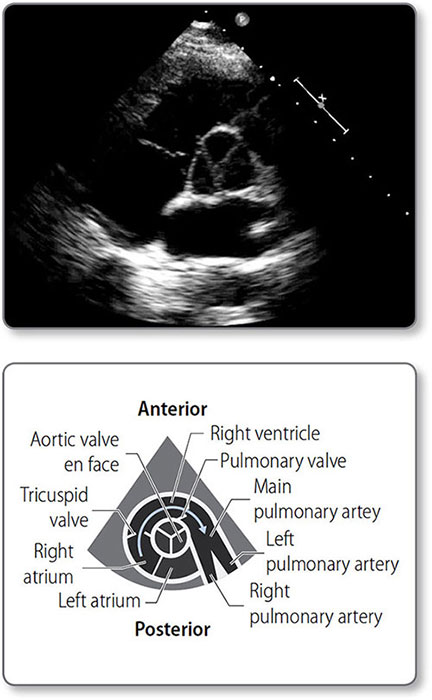
Figure 1.6: Transthoracic echocardiogram showing the circular left ventricle (LV). The lower pressure right ventricle (RV) accommodates the higher pressure left ventricle.

Figure 1.7: An exploded view of the left atrium (LA) ①, left ventricle (LV) ② and mitral valve ③. The left atrial appendage ④ orifice and a pulmonary vein ⑤ are visible in the LA. Trabeculations of the LV are coarser than those of the right ventricle ⑥. The mitral valve leaflets ③ are tethered to the papillary muscles ⑦ by the chordae tendinae. Courtesy of Dr K Suvarna.
8Blood enters the left ventricle through the mitral valve and exits via the aortic valve. The outflow tract is posterior to the right outflow tract, which ‘wraps’ around the aorta. Blood supply is from the left anterior descending (LAD) artery and its diagonal branches.
Aortic valve and aortic root
The aortic valve has three semilunar cusps (Figure 1.8). The aortic root is directly above the valve, and has three dilations, or sinuses, two of which are the origin of coronary arteries.
The ascending aorta continues superiorly and toward the right before bending leftwards and posteriorly, arching over the left lung hilum.
Right atrium
9The right atrium receives deoxygenated blood from the superior and inferior venae cavae and coronary venous blood through the coronary sinus. The smooth posterior surface is separated from the trabeculated anterior surface by the crescent-shaped crista terminalis muscle.
The trabeculated right atrial appendage – the auricle – projects from the superoanterior segment of the atrium.
Tricuspid valve
The tricuspid valve has anterior, posterior and septal leaflets. Their free edges are attached to the ventricular walls by the chordae tendinae and papillary muscles, which are smaller than the left subvalvular apparatus.
Right ventricle
The right ventricle, like the left, is an elongated inverted cone shape, but operates at a much lower pressure. As a result, the left ventricle and interventricular septum bulge into the right ventricular cavity (Figure 1.6).
The moderator band is a ridge of muscle that extends from the septum to the anterior wall at the base of the papillary muscle. It is part of the electrical conduction pathway that ensures the right-sided papillary muscles contract before the ventricle does, to ensure the tricuspid valve is braced for systole.
Pulmonary valve
The pulmonary valve is a tricuspid, semilunar valve at the apex of the right ventricular outflow tract.
Blood supply and drainage
Coronary heart disease (CHD) is a disease of the coronary arteries, and clinical understanding requires a thorough knowledge of the heart's blood supply.
Arterial supply
The left coronary artery (LCA) usually originates from the left coronary sinus, and the right coronary artery (RCA) emanates from the right coronary sinus.
The arteries run along the epicardial surface of the heart until they branch into smaller arteries, which penetrate and supply the myocardium. They are effectively end arteries, with only minimal anastomoses between them.
Left coronary artery
The LCA passes behind the pulmonary artery and along the atrioventricular groove, where it divides into the left anterior descending and circumflex arteries (Figure 1.9).

Figure 1.9: The left coronary artery. (a) Relations with other cardiac structures. (b) Left-sided angiogram of the left coronary artery. A coronary catheter is sitting in the aortic root, where it injects X-ray contrast material into the left main stem. ①, coronary catheter; ②, diagonal artery; ③, left anterior descending artery; ④, obtuse marginal artery; ⑤, circumflex artery.
11The LAD artery roughly follows the line of the anterior septum down to the apex. It provides diagonal branches to the left ventricle laterally, and septal branches inferiorly to the interventricular septum.
The circumflex artery winds around the left lateral surface of the heart in the atrioventricular groove toward the inferior surface. Distally, it anastomoses with right-sided vessels on the inferior surface of the heart. Along its length, it supplies obtuse marginal branches that supply the high lateral wall of the left ventricle.
Right coronary artery
The RCA usually supplies the sinoatrial (SA) node, right ventricle, atrioventricular node and inferior surface of the left ventricle (Figure 1.10). It travels in the right atrioventricular groove to the inferior surface of the heart. From here, it usually supplies the posterior descending artery lying along the line of the inferior interventricular septum. Proximally, the RCA supplies a branch to the SA node. It also provides a branch to the right ventricle in its midsection.

Figure 1.10: The right coronary artery. (a) Relations with other cardiac structures. (b) Angiogram taken from in front of the patient. The right coronary artery ① winds around the right atrioventricular groove, from which it branches to the sinoatrial (SA) node ② and right ventricle ③ before travelling down the inferior surface of the heart. A catheter ④ is visible in the descending aorta and in the aortic root at the right coronary ostium.
Arterial dominance
Arterial dominance is determined by the artery that supplies the AV node (and usually the posterior descending artery):
- 75% are right-dominant (RCA)
- 15% are left-dominant (LCA)
- 10% are codominant.
Venous return
The great cardiac vein drains the anterior, posterior and lateral myocardial walls. It runs alongside the LAD artery and then in the left atrioventricular groove and empties into the right atrium through the coronary sinus. The middle cardiac vein begins at the apex, accompanies the posterior descending artery and drains into the coronary sinus.
Many right ventricular veins drain through the small cardiac vein directly into the right atrium.
The cardiac conduction pathway
The cardiac conduction pathway governs the route of myocardial depolarization and therefore pattern of its contraction (Figure 1.11). It is formed by:
- The SA node – spontaneously depolarizing pacemaker cells (see page 34) in the superior posterior right atrium
- Atrial cardiomyocytes that propagate depolarization
- The atrioventricular node – normally the only electrical connection between the atria and the ventricles
- The bundle of His and Purkinje fibers – specialized conduction fibers in the ventricular septum and ventricles, respectively
- Ventricular cardiomyocyte propagation
Other than at the AV node, insulating fibrous tissue prevents conduction between the atria and ventricles. The node 13causes a pause in conduction, ensuring that ventricular filling is complete before contraction begins.

Figure 1.11: The conduction pathways of the heart. The sinoatrial (SA) node ①, Bachmann's bundle ②, atrioventricular node ③, bundle of His ④, which divides into left and right bundle branches. Purkinje fibers ⑤ rapidly conduct to the ventricles. Fibroannular rings ⑥ (shown in yellow) insulate the ventricles from the atria.
The bundle of His
The bundle of His descends in the ventricular septum and branches toward the right and left ventricles. The left bundle further divides into an anterior and a posterior branch, which subsequently form Purkinje fibers. These innervate the myocardium so that ventricular contraction starts at the apex and spreads to the base. This allows the efficient ejection of blood and ensures that the papillary muscles contract in time to prevent tricuspid or mitral valve regurgitation.
The pericardium
The pericardium is a double-membrane sac covering the heart and proximal segments of the great vessels. The outer tough fibrous pericardium protects the heart. The serous pericardium has two layers with a cavity in between:
- Parietal pericardium – a layer of mesothelial cells continuous with the fibrous pericardium
- The pericardial cavity containing a lubricating fluid to reduce friction
- Visceral pericardium that lines the epicardium.
It also contains lymphatic tissue with a role in immune function.
14The phrenic nerve innervates the fibrous and parietal layers, whereas the visceral layer is innervated by the autonomic nervous system (ANS).
VESSELS
Ventricular contraction forces blood through the arteries under high pressure. As arteries branch, the number of blood vessels increases but their individual calibre decreases. Vast networks of capillaries perfuse tissues, in which substances are exchanged between blood and cells. Veins return blood to the heart under low pressure.
All vessels are cylindrical tubes of connective tissue and endothelial cells, and large vessels also have muscular, nervous, lymphoid and even vascular tissue.
Structure
All blood vessels, except capillaries, have three layers (Figure 1.12).
Tunica intima
This innermost layer is a single layer of endothelial cells, supported by a thin layer of connective tissue – lamina propria – and longitudinal elastic fibers, the internal elastic lamina. The luminal surface of the endothelial cells is in contact with blood in the lumen.

Figure 1.12: General structure of the walls of blood vessels. Vaso vasorum are the blood vessels to blood vessels; nervi vascularis are the nerves innervating vessels.
Tunica media
15The middle layer consists of smooth muscle cells and elastic fibers in a circumferential arrangement. The smooth muscle is innervated by the sympathetic nervous system to control tone, i.e. vessel diameter. The external elastic lamina provides additional support
Tunica externa
This outermost layer is mainly collagenous connective tissue and is fused with surrounding connective tissue to anchor vessels in place.
Types
The structure of each vessel type reflects its function (Table 1.2).
Elastic arteries
These are the major proximal arteries: the aorta and the brachiocephalic, carotid, subclavian, iliac and pulmonary arteries. Their tunica media contain many elastic fibers, which convert the intermittent, pulsatile blood flow from heart contraction into the continuous flow allowing constant tissue perfusion. They absorb energy during systole and discharge it in diastole.
Muscular arteries
Muscular – or distributing arteries – distribute blood to the resistance arterioles. They have multiple layers of smooth muscle in their tunica media, and include the radial, mesenteric and femoral arteries.
Arterioles
Arterioles are known as resistance vessels because they regulate systemic vascular resistance (Figure 1.13). They contain one or two layers of smooth muscle that are autoregulating and affected by neuroendocrine control (see page 49).
Arteriolar muscular tone is the primary controller of perfusion as these vessels supply capillary beds.
|
Capillaries
Capillaries consist of a single endothelial cell layer. They are 5−20 μm in diameter and about 1 mm long. However, they have a very large combined cross-sectional area, which results in a slow transit time. Known as exchange vessels, they are the site of gas, nutrient and waste product exchange between blood and tissues.
The microcirculation
The microcirculation is the functional unit of small vessels perfusing an organ or tissue (Figure 1.14). It consists of the:
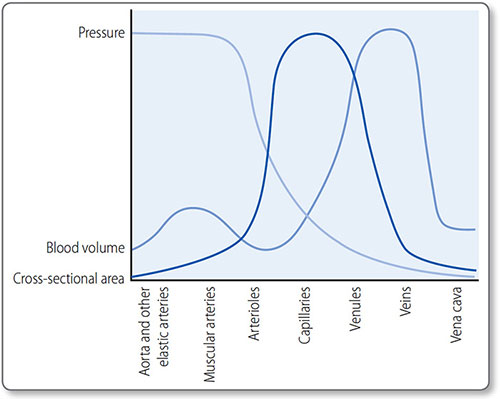
Figure 1.13: Pressure, blood volume and surface area at each level of circulation. The largest pressure drop occurs at the resistance vessels (arterioles), capillaries have the largest surface area and veins (capacitance vessels) hold the most volume.
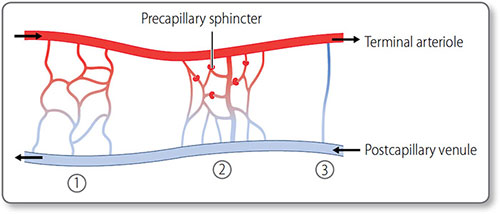
Figure 1.14: The microcirculation. ①, The simple branched microcirculation architecture present in most tissues. ②, Central metarteriole, a thoroughfare channel with branching capillaries. ③, Direct atrioventricular anastomosis found in cutaneous tissues.
- Capillary bed
- Post-capillary venules
- Metarterioles, which bypass the capillary bed.
Microcirculation is regulated by terminal arteriolar tone, extrinsically by sympathetic innervation, and intrinsically, via autoregulation.
Precapillary sphincters These rings of vascular smooth muscle encircle the entrance to capillary beds. They control whether blood enters that bed or is shunted via metarterioles to post-capillary venules.
Venules and veins
Post-capillary venules join to form larger venules, which join to form veins.
Venules and veins have a much thinner tunica media and less smooth muscle than arteries and arterioles. They are thin, compliant and lack elastic recoil. Consequently, they accommodate large increases in blood volume with minimal increase in pressure. The large combined cross-sectional area means resistance is low, so their low pressures are sufficient to return blood to the heart.
The large capacity of veins acts as a reservoir of blood and is regulated by the ANS. Sympathetic activation, for example, results in venous constriction, increasing venous return (and central venous pressure). Venous return is aided by the skeletalmuscle pump, where skeletal muscular contraction forces blood toward the heart and venous valves prevent backflow.
Key regional vascular anatomy
Carotid arteries
The right common carotid artery is a branch of the brachiocephalic artery. The left emerges directly from the aortic arch. The common carotid arteries bifurcate at the level of the C3–C4 vertebrae into the internal and external carotid arteries (Figure 1.15).
The internal carotid artery The internal carotid artery enters the skull through the carotid canal, passes through the cavernous 19sinus and supplies the ophthalmic artery. Its terminal branches are the middle and anterior cerebral arteries.

Figure 1.15: Arteries of the neck and face. ①, superficial temporal artery; ②, maxillary artery; ③, masseter muscle; ④, facial artery; ⑤, internal carotid artery; ⑥, occipital artery; ⑦, lingual artery; ⑧, carotid bifurcation; ⑨, superior thyroid artery; ⑩, thyroid cartilage (vertebral level C5); ⑪, scalenus anterior; ⑫, transverse cervical artery; ⑬, suprascapular artery; ⑭, vertebral artery; ⑮, common carotid artery; ⑯, thyrocervical trunk; ⑰, subclavian artery; ⑳, internal thoracic artery. The best position to palpate the carotid artery is lateral to the larynx at the level of the thyroid cartilage ⊗.
The external carotid artery The external carotid artery supplies parts of the thyroid, larynx, tongue and superficial neck, face and head (Table 1.3).
Carotid sinus The carotid sinus is a dilation in the carotid artery, just below the bifurcation of the common carotid artery. It contains baro- and chemoreceptors involved in the regulation of blood pressure and ventilation (see page 59).
|
The gut
The arterial supply to the gut is from branches of the abdominal aorta (Table 1.4), which enters the abdomen behind the diaphragm at the level of the T12 vertebra. It then descends, to the left of the midline, and divides at L4 into the common iliac arteries.
Renal vessels The renal arteries arise as lateral branches from the aorta at the level of the L1 vertebra (Figure 1.16). They are large in caliber – 0.5–1 cm – reflecting the high level of kidney perfusion, about a quarter of total cardiac output. They divide into segmental, lobar, interlobar and arcuate arteries before becoming the afferent arterioles supplying the glomeruli.
|
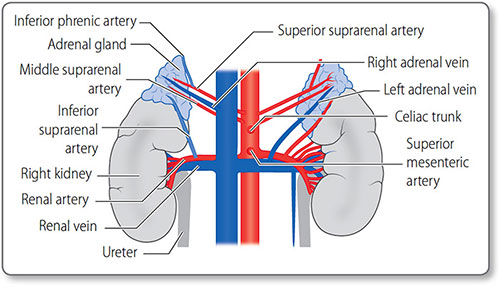
Figure 1.16: The arteries and veins of the kidneys and adrenal glands. The major vessels are the inferior vena cava and the abdominal aorta.
The renal veins mirror the arteries along their course.
Adrenal vessels The adrenal glands also have a rich blood supply via their superior, middle and inferior suprarenal arteries. These usually arise from the inferior phrenic artery, aorta and renal arteries, respectively. The right adrenal vein drains into the inferior vena cava, whereas the left drains into the left renal vein.
1.2 Development of the cardiovascular system
22The heart and vessels form by vasculogenesis, de novo vessel formation from endothelial precursors called angioblasts in the embryo. This stem cell budding is guided by genetic signals that orientate the direction and extent of growth. Further growth of small vessels occurs via angiogenesis, where vascular cells arise from already formed endothelial cells.
Development of the heart
The heart is the first organ to function and starts beating 3 weeks after fertilization. It initially forms a single tube that then folds, loops and is divided by septae to form the four chambers and major vessels.
Endocardial tubes
The three layers of cardiac tissue – endocardium, myocardium and epicardium – develop from cardiogenic mesoderm at the cranial end of the embryo:
- Day 18: bilateral clusters of angioblasts form paired endocardial (heart) tubes
- Embryonic folding aligns these tubes in the midline on the ventral surface
- Day 21: the two tubes fuse to form a single-chambered heart with five segments that develop into chambers (Figure 1.17 and Table 1.5). Myocyte rhythmic activity begins before tube fusion
- By week 4 contraction starts pumping blood in a caudal to cranial direction.
Looping
On days 23–28, the growing tube folds and loops to the right (Figure 1.17b) to produce:
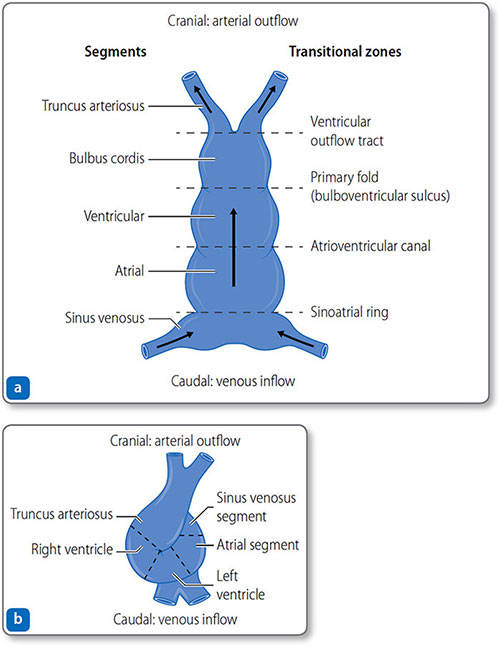
Figure 1.17: The heart tube. (a) Day 21: the heart tube has five distinct segments and four transitional zones. (b) Day 23–28: the tube folds and loops to resemble the mature heart.
|
- Cranial segments: primitive ventricle and truncus arteriosus (the outflow tracts).
Once aligned, the atrial and ventricular segments begin to expand, differentiate and trabeculate. Externally, the heart starts to resemble the mature structure but internally remains a relatively simple folded, looped tube until the chambers and outflow tracts are divided by septation, the formation of tissue septa.
Atrioventricular septation
From day 26, cells surrounding the atrioventricular canal start to infiltrate the cardiac jelly, the gelatinous substance in-between the myocardium and endocardium. These form endocardial cushions – tissue that grows horizontally to form the valves and vertically, the septa.
Ventricular septation
Ventricular septation begins on day 25. From the apex of the cardiac loop, between the left ventricle and the bulbus cordis (the primary heart loop), the muscular interventricular septum starts to develop toward the endocardial cushions. The truncoconal septum extends inferiorly into the ventricular cavity to form the membranous portion of the interventricular septum.
Ventricular septation is completed in week 7 when the primary muscular septum, the truncoconal septum and the atrioventricular endocardial cushions fuse. This joins the ventricular and outflow tract septae, which connect the left and right ventricles to the aortic and pulmonary outflow tracts, respectively.
Atrial septation
Atrial septation starts around day 30, when the septum primum descends from the roof of the atrium toward the endocardial cushions. In the fetus, blood shunts through the orifice primum. Once this is obliterated by the fusion of the septum primum and the endocardial cushions, the second ostium develops.
25The septum secundum then develops directly to the right of the septum primum. Both septae have posteroinferior windows that together form the foramen ovale. This flap valve allows right-to-left blood flow (Figure 1.18) and closes when systemic blood pressure increases after birth.
Dorsally, the left horn of the sinus venosus forms the coronary sinus, which empties into the right atrium. The right horn becomes incorporated into the structure of the right atrium.
The primordial pulmonary vein merges with the left atrium in week 5. By week 8, all four pulmonary veins are absorbed.
Outflow tract septation
The truncus arteriosus is a common outflow tract. From week 5, along its length endocardial ridges form in a spiral arrangement. When these meet in the middle and fuse, they form a septum that separates the aortic outflow tract from the pulmonary outflow tract). The same process is responsible for development of the aortic and pulmonary semilunar valves, and is completed by the end of week 8.
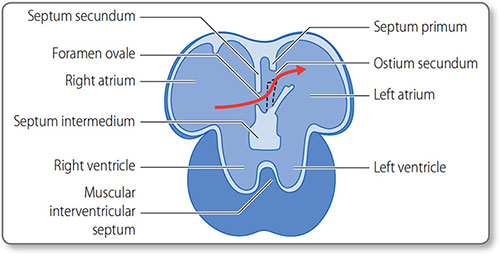
Figure 1.18: Fetal heart circulation. The interatrial septa and the foramen ovale flap valve (black dashed line). The rigid septum secundum grows alongside the septum primum. Fast flowing blood from the ductus venosus is directed across the atrial septae through the foramen ovale flap valve (red arrow). The valve closes after birth due to increased left atrial pressure.
The conduction tissue
26Conduction tissue cells develop from the transitional zones of the heart tube. Regular contraction begins on day 22, before conduction tissues are formed. By the 7th week, cells in the primitive atrium start to differentiate into the specialized pacemaker cells of the SA node, and cells of the sinus venosus into the AV node.
Development of vessels
Most vessels form by budding vasculogenesis from angioblasts. This initially forms a network of capillaries, with larger vessels formed as key pathways are enlarged. Further capillaries form via angiogenesis.
Arterial development
Arteries develop from the six, more ventral, paired aortic arches, along with the metabolic needs of the developing fetus (Figure 1.19):
- The first three arches develop into the arteries of the head and neck
- The 4th pair develop into the aortic arch and subclavian artery
- The 5th arches completely regress
- The 6th right arch develops into the right pulmonary artery, and the left arch develops into the left pulmonary artery and the ductus arteriosus.
Coronary arteries
The coronary arteries originate from ventricular endocardial cells, at the right and left aortic sinuses of Valsalva.
Venous development
Veins mainly form from three bilateral veins in weeks 4–8:
- The cardinal system drains the head and body
- The umbilical system supplies O2– and nutrient-rich blood from the placentaFigure 1.19: The aortic arches and dorsal aortae. The six arches develop and (some) regress at different times. Pair 1 regress but remnants form the adult maxillary and stapedial arteries. The 3rd pair form the carotid arteries. Pair 4 form the arch of the aorta (left) and the right subclavian artery. The 5th pair regress. Pair 6 contribute to the pulmonary arteries with the left also forming the ductus arteriosus. The dorsal aorta fuse in the midline forming the descending aorta.

1.3 Cardiovascular physiology
Key physiological and biochemical processes to understand in CHD are:
- Electrophysiology
- The autonomic control of the heart
- The cardiac cycle
- Blood flow
- Blood pressure
- Hemostasis
- Lipid and cholesterol metabolism.
28Vascular inflammation and immunology, particularly endothelial cell involvement, are also central in the development of atheroma, but are beyond the scope of this book.
Electrophysiology
The cardiac cycle starts with the spontaneous initiation of an action potential – the cardiac impulse – by pacemaker cells of the SA node. This wave of depolarization then conducts along specialized conduction tissues and cardiomyocytes, causing them to contract.
Cardiomyocytes
Cardiomyocytes are branched, tubular cells with a central nucleus (Figure 1.20). They connect end to end at intercalated discs. The discs contain desmosomes that anchor cells together, and gap junctions, which allow action potentials to conduct freely between cells.
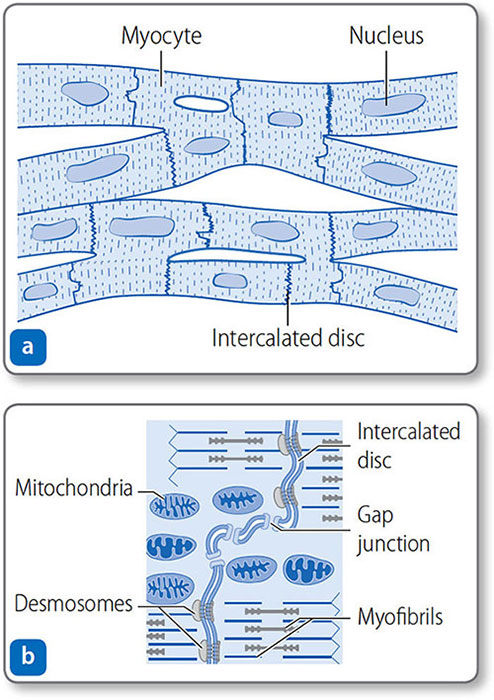
Figure 1.20: Cardiac muscle. (a) Cardiomyocytes are branched, nucleated, elongated, tubular cells joined at intercalated discs. (b) Close up of an intercalated disc. Desmosomes anchor cells, and gap junctions allow ions to pass freely between cells.
Resting membrane potential
29Myocardial membranes have an electric charge – a resting potential of –90 mV, which allows them to conduct the cardiac impulse. This reflects unbalanced ion concentrations and selective membrane permeability maintained by membrane ion channels.
The main ions involved are the cations K+, Na+ and Ca2+ (Table 1.6):
Stage 1
Membrane-bound ion pumps actively pump K+, Na+ and Ca2+ out of the cell to make a small contribution to the RMP (Figure 1.21):
- Na+/K+-ATPase pumps three Na+ ions out of the cell and two K+ ions into the cell
- Ca2+-ATPase pumps Ca2+ out of the cell and into the sarcoplasmic reticulum
- The Na+–Ca2+ exchanger exchanges three Na+ ions for one Ca2+ ion.
Stage 2
The membrane is permeable to K+ but not other ions. K+ therefore passively diffuses out of the cell, down its concentration gradient, increasing the intracellular negative charge.
Stage 3
K+ efflux continues until equilibrium is reached between its concentration gradient and its electrochemical gradient. This equilibrium potential (E) is determined by ionic charge and the concentration gradient. For K+, EKis around –96 mV.
|
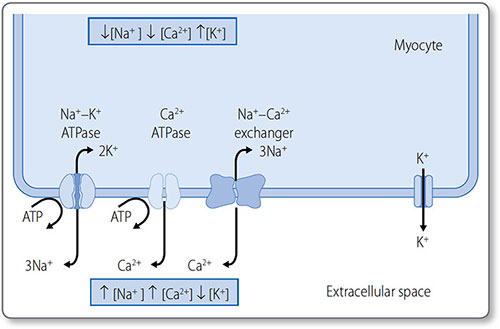
Figure 1.21: The resting membrane potential across the cardiomyocyte membrane. The three ion pumps (left) consume ATP to generate steep ionic concentration gradients. The membrane is permeable to K+ but less permeable to other ions. Therefore, K+ diffuses passively down its concentration gradient (right), leaving less positive charge (i.e. a net negative charge) on the inside of the cardiomyocyte.
Stage 4
The membrane potential (E
m) is equal to the sum of the equilibrium potentials of all the ions, proportional to their ability to cross the membrane (conductance, g):
Em = (gK × EK) + (gCa × ECa) + (gNa × ENa)
This is predominately determined by EK, as K+ has the highest conductance. Hence overall RMP is close to EK.
Gated ion channels
The cycles of depolarization and repolarization are controlled by membrane ion channels (Table 1.7). Ion channels are ‘gated’ 31in that they are activated (open) or inactivated (closed) by local factors such as voltage, ligand binding or receptor activation (Table 1.8).
|
|
Movement of charged particles, ions, generates an electrical current. Most of the current of depolarization is from Na+ influx (i.e. INa), which occurs until Na+ channels are deactivated.
Cardiomyocyte depolarization
The cardiomyocyte action potential has five phases (0–4) controlled by ion channel activation and inactivation (Figure 1.22). Phase 4 corresponds to diastole and phases 1 and 2 to systole.
Phase 4: resting
The membrane is permeable to K+ and relatively impermeable to other ions. Cardiomyocytes are held at RMP, polarized between –90 and –95 mV.
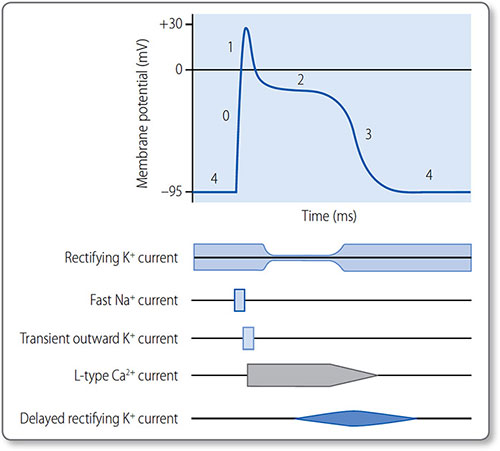
Figure 1.22: The cardiac action potential and the activation and inactivation of gated ion channels. The phases are 0, depolarization; 1, transient partial repolarization; 2, plateau; 3, repolarization; and 4, resting.
33Phase 4 ends when a depolarizing electrical stimulus is conducted to the myocyte from a neighbouring cell. If it increases the membrane potential to –60 mV, an action potential (phase 0) is triggered.
Phase 0: depolarization
The threshold potential activates voltage-gated fast Na+ channels and Na+ ions rush into the cell, down a steep concentration gradient. INa rapidly increases the membrane potential to around +30 mV, when fast Na+ channels abruptly inactivate.
Phase 1: transient partial repolarization
Voltage-gated, transient outward K+ channels activate to allow a brief efflux of K+ (Ito). This causes a brief partial repolarization.
Phase 2: plateau
Voltage-gated L-type Ca2+ channels activate and inactivate slowly, which prolongs inward Ca2+ current (ICa); this sustains the action potential for around 250 ms and triggers myocyte contraction.
Toward the end of phase 2, Na+–Ca2+ exchangers allow slow entry of Na+, extending the plateau phase.
Ca2+ and Na+ influx is opposed by outward rectifying K+ currents.
Phase 3: repolarization
As the L-type Ca2+ channels inactivate, delayed rectifying K+ channels open. The now unopposed K+ efflux causes rapid repolarization.
Refractory periods
The absolute refractory period is the time during phases 1 and 2 in which another action potential cannot be initiated. It is due to inactivation of fast Na+ channels, which are not reactivated until phase 3. The relative refractory period is the time during their reactivation, when depolarization can occur but depends on the magnitude of the stimulus and the number of reactivated channels (Figure 1.23).
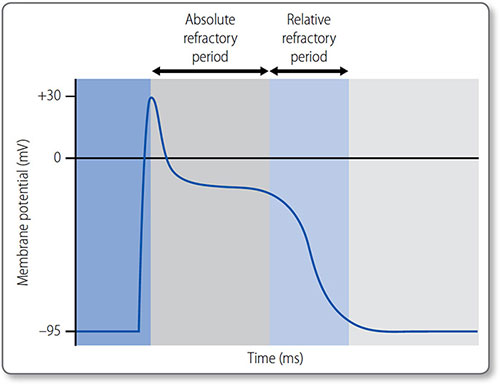
Figure 1.23: The absolute and relative refractory periods of an action potential in a cardiomyocyte.
Pacemaker depolarization
Pacemaker cells are cardiomyocytes that can spontaneously depolarize, found in the SA and AV nodes and conducting tissues. This automaticity – regular, spontaneous firing – is due to:
- A less negative resting potential (Em = –60 mV)
- Leaky Na+ channels.
A relatively high Na+ permeability means they slowly depolarise until a threshold at –20 mV. This opens voltage-gated Ca2+ and slow Na+ channels, causing cation influx and an action potential spike (Figure 1.24).
Pacemaker potentials
The rate of inward Na+ and Ca2+ currents (I Na and I Ca) during phase 4 determines the rate of action potential generation and therefore heart rate.

Figure 1.24: The action potentials of a pacemaker and a non-pacemaker cardiomyocyte. In a pacemaker cell, the resting potential (phase 4) is less negative and constantly drifts toward the firing threshold.
Pacemaker hierarchy
Multiple pacemaker sites provide a ‘back up’, though the fastest pacemaker functioning – the SA node in health – always assumes overall control. The more distal the pacemaker (relative to the SAN), the slower its intrinsic rate (Table 1.9).
Conduction pathway
The atrioventricular fibrous skeleton prevents the wave of depolarization spreading into the ventricles. The AV node is normally the only electrical connection from the atria to the ventricles. The node slows conduction, allowing complete atrial emptying into the ventricles. Depolarization then spreads rapidly down the septum via specialized Purkinje fibers in the bundle of His (Figure 1.11).
|
Cardiomyocyte contraction
Myofibrils
Myocytes contain elongated myofibrils composed of functional units called sarcomeres (Figures 1.25 and 1.26). Each sarcomere is bounded at each end by a Z line and contains contractile filaments made of the proteins actin and myosin. Peripherally, actin thin filaments attach to the Z line. Centrally, myosin thick filaments interdigitate (i.e. overlap) with the actin filaments.
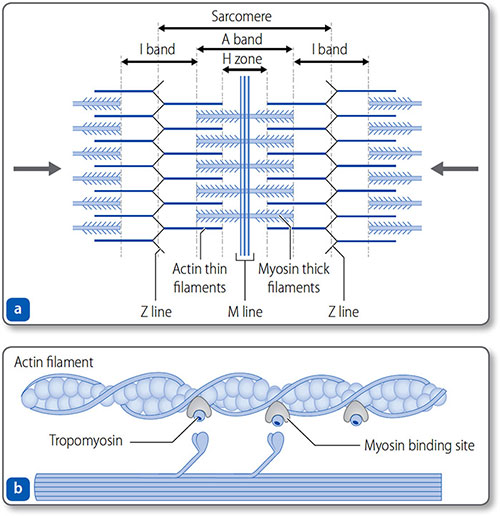
Figure 1.25: The sarcomere. (a) The sarcomere is bound by the Z lines – formed by the arbed ends of thin actin filaments. The filaments project centrally, where they interdigitate with thick myosin filaments. This gives the striated appearance of cardiomyocytes, defined by the M line, the H zone and the A and I bands. (b) Actin−myosin interaction.
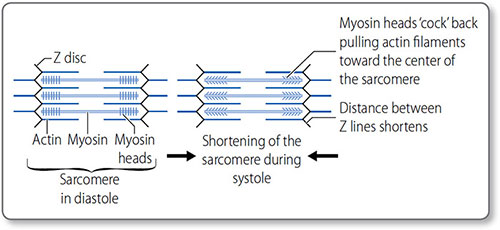
Figure 1.26: Sarcomeres and the sliding filament mechanism of myocardial contraction. Within the sarcomere, the central thick myosin filaments are surrounded by the thin actin filaments. Contraction of the many myocardial sarcomeres underlies contraction, and causes the H band to disappear, the A band to increase and the I band to shorten.
Sarcolemma
The cell membrane – the sarcolemma – invaginates deeply into the myocyte around the Z lines to form T tubules. These are closely associated with sarcoplasmic reticulum, which contains intracellular stores of Ca2+. This enables the rapid coupling of membrane (i.e. T tubule) depolarization with the release of Ca2+ from the sarcoplasmic reticulum to stimulate myofibril contraction.
Myofibril contraction
Thin filaments consist of actin, tropomyosin and troponin complexes (Figure 1.27).
- Troponin T attaches each troponin complex to the tropomyosin
- Troponin I inhibits the binding of myosin heads to actin
- Troponin C binds to Ca2+.
The binding of Ca2+ to troponin C exposes the myosin-binding site, allowing actin−myosin cross-bridges to form.
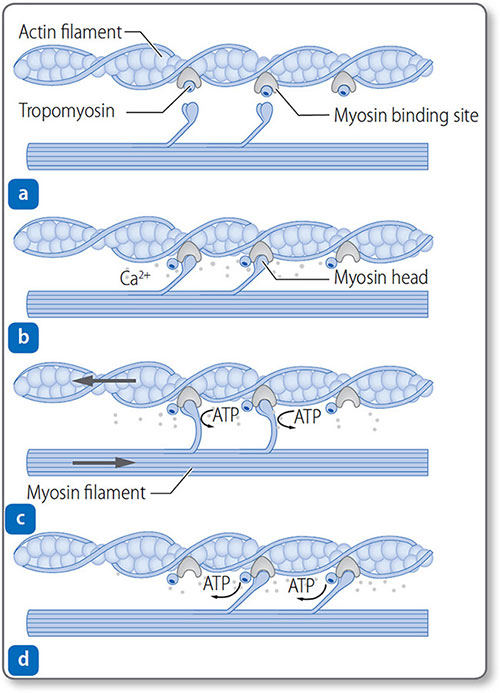
Figure 1.27: Mechanism of myocardial contraction. (a) Myosin-binding sites on actin filaments are blocked by tropomyosin. Ca2+ released after depolarization binds to troponin. (b) Troponin changes conformation, exposing the binding site. Myosin heads bind actin. (c) Power stroke occurs as myosin heads pull filaments and shorten the sarcomere. (d) Myosin heads reset and can rebind.
The sliding filament model of contraction The myosin ‘power stroke’ pulls the filaments so that they slide in opposite directions; this sliding shortens the sarcomere and in turn contracts the myocardium. Cycles of myosin-head binding to actin, contracting, disconnecting and then reattaching – a ‘ratcheting’ effect – progressively shorten the sarcomere as long as intracellular Ca2+ remains high. Both contraction and relaxation are energy dependent 39(ATP consuming). In the heart this is a continual cycle hence the large concentration of mitochondria and glycogen stores.
Inotropism
Inotropism is the ability of an agent to affect muscle contractility (see page 46); positive inotropes enhance contractility and negative inotropes reduce contractility.
Autonomic control of the heart
The cardiovascular center is a collection of nuclei in the medulla oblongata, and is the branch of the ANS responsible for cardiovascular homeostasis and control. It receives sensory input from peripheral chemo- and baroreceptors, and higher control from the thalamus, hypothalamus and cerebral cortex (Figure 1.28). Through its modulated output it regulates:
- Heart rate (see page 47)
- Cardiomyocyte contractility (see page 46)
- Global blood flow (see page 49)
- Blood pressure (see page 58).
The sympathetic nervous system
Sympathetic signals are transmitted from pre-ganglionic neurons in the lateral thoracic and lumbar spinal cord (levels T1–L2). These synapse with post-ganglionic neurons within the right and left paravertebral ganglia (the sympathetic chains).
Sympathetic nerves innervate the atrial and ventricular myocardium, SA node, AV node and conduction tissues. They release noradrenaline (norepinephrine), which – along with adrenaline (epinephrine) in the bloodstream – activates β1 adrenoreceptors in the heart.
Effects
Activation increases intracellular cyclic AMP (cAMP) and protein kinase A activation, causing changes in ion channel gating (Table 1.10), and thereby increases:
- Heart rate, i.e. chronotropicity
- Contractility, i.e. inotropicity
- Myocardial relaxation, i.e. lusitropicity
- Conduction through the AV node, i.e. dromotropicity.
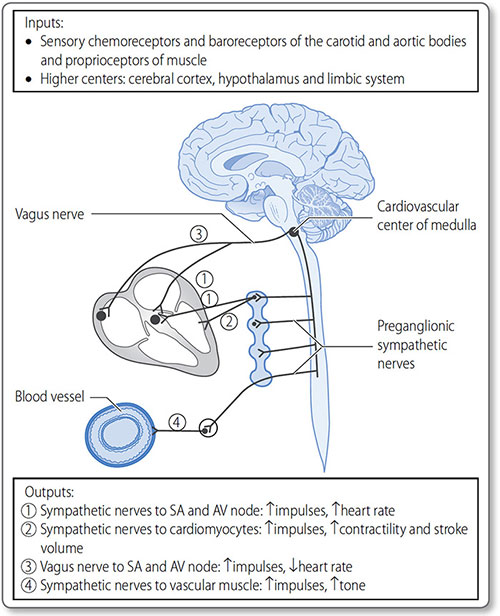
Figure 1.28: The cardiovascular center of the medulla is responsible for the global control of heart rate, contractility and stroke volume, as well as vascular tone, the core determinant of blood pressure.
The parasympathetic nervous system
Efferent parasympathetic innervation of the heart is through the right and left vagus nerves (cranial nerve X), which originate in the nucleus ambiguous of the medulla oblongata. Pre- and post-ganglionic neurons synapse very close to the heart. Post-ganglionic neurons primarily innervate the atrial myocardium, SA node and AV node.
|
Vagal activation releases acetylcholine, which binds to muscarinic M2 receptors, antagonizing cAMP production and protein kinase A activation. Vagal activation also results in K+ channel activation and hyperpolarization of the myocyte membrane.
The parasympathetic nervous system reduces heart rate by reducing pacemaker potentials.
The cardiac cycle
The cardiac cycle is the series of the events occurring every heat beat (Figure 1.29, Table 1.11).
Atrial systole
Atrial contraction (systole) is the active phase of ventricular filling that follows passive filling. At rest, it contributes 10−20% of total end-diastolic volume. This contribution decreases as the heart rate increases.

Figure 1.29: The cardiac cycle can be interpreted by electrocardiography, blood pressure dynamics and heart sounds.
A small pressure wave – the a wave – is detectable in the veins during this phase, as the atria are continuous with the great veins which do not have valves.
Atrial systole indirectly contributes to cardiac output as ventricular stroke volume is proportional to end-diastolic volume.
|
Ventricular systole
During ventricular systole:
- Ventricles contract
- Atrioventricular valves close (heart sound S1)
- Semilunar valves open
- Blood is ejected.
As the atrioventricular valves bulge into the atria, they produce a c pressure wave in the venous pulse when they close.
Ventricular pressure increases
The semilunar valves remain closed until the ventricular pressure exceeds the aortic and pulmonary artery pressures. This phase is called isovolumetric contraction because the ventricular pressure increases without any change in ventricular volume.
Ventricular ejection
Once the semilunar valves open, the pressure gradient across the valves is minimal and blood is powerfully ejected into the aorta and pulmonary arteries.
Atrial diastolic fillixng occurs during ventricular systole with a corresponding increase in atrial pressure (the v wave).
Ventricular diastole
During ventricular diastole:
- Ventricles relax
- Semilunar valves close
- AV valves open.
Ventricular systole continues until arterial pressures are slightly greater than ventricular. This allows a very brief reversal of flow that closes the semilunar valves (S2).
Ventricular relaxation
Ventricular pressure continues to decrease after the semilunar valves close. Ventricular volume is unchanged until the AV valves open, hence this phase is isovolumetric relaxation time. Ventricular relaxation is not passive, and active recoil of the ventricles helps to suck in blood during the next phase.
Atrioventricular valves open
The AV valves open as soon as atrial pressure exceeds ventricular, just after the point of peak atrial filling and pressure (the v pressure wave). Atrial pressure decreases rapidly. Ventricular filling is rapid at first and then slows as the pressure gradient declines.
Finally, atrial systole starts the next cycle.
Blood flow
At rest, total blood flow – cardiac output (CO) – is about 5 L/min. This can increase to 30 L/min during strenuous exercise. Both the total and local flow of blood are closely regulated to match global and local metabolic need.
Global control – the cardiovascular center
The cardiovascular center controls the rate and force of heart contraction and global vascular tone (see Figure 1.28).
Cardiac output
Therefore, the cardiovascular center controls total blood flow by adjusting heart rate (see page 47) or stroke volume.
Stroke volume
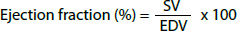
Stroke volume is the volume of blood ejected with each heartbeat:
SV = end-diastolic volume (EDV) – end-systolic volume (ESV)
It is influenced by preload, myocardial contractility and afterload.
The ejection fraction (EF) is the percentage of blood ejected from the ventricle with each heartbeat. It is normally 50–70% but is reduced in heart failure.
Cardiac preload Preload is end-diastolic ventricular pressure. An increase in preload increases end-diastolic and stroke volume.
The myocardium is at its most stretched at the end of diastole, which has two effects:
- More active actin–myosin cross-bridges form
- The affinity between Ca2+ and troponin C increases.
This is the basis for the Frank–Starling law: ‘the mechanical energy discharged during ventricular systole is a function of initial fiber length’, i.e. more myocardial stretch leads to a more forceful contraction (Figure 1.30). This is how:
- Left and right circulations equalize
- Exercise increases venous return and therefore CO
- Reduced venous return (e.g. hemorrhage) decreases CO.
Venous muscular tone can also affect venous return:
- An increase – e.g. sympathetic activation – increases venous return
- A decrease in tone decreases venous return.
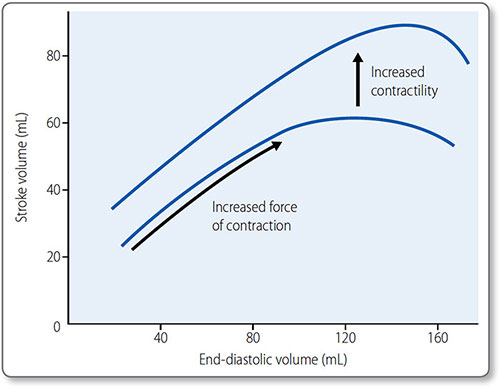
Figure 1.30: The Frank−Starling curve. An increase in end-diastolic volume results in a greater stroke volume. In the physiological range, the curve is steep as ventricles are particularly sensitive to changes in end-diastolic volume. Beyond the physiological range, the curve plateaus; further increases in end-diastolic volume do not increase stroke volume. The effect of raised contractility (often referred to as increased sympathetic tone) is demonstrated in the upper curve.
Contractility Contractility is the force of myocardial contraction, independent of preload. Inotropes affect contractility (Table 1.12) and are also the name of a class of drugs with positive inotropic effects ((e.g. digoxin; see page 156).
A positive inotropic agent – such as sympathetic activation or increased myocardial stretch – increases cardiomyocyte contraction, usually by increasing Ca2+ influx, which causes more actin−myosin cross-bridges to form.
Sympathetic activation increases contractility and heart rate via β1 adrenoreceptors (see page 39). An increase in contractility shifts the Frank–Starling curve upwards.
Parasympathetic activation reduces rate but has no effect on contractility due to minimal parasympathetic innervation of myocardium.
|
Afterload Afterload is the ventricular tension required to eject blood against aortic or pulmonary artery pressures. An increase in afterload increases end-systolic volume and reduces stroke volume.
Tension is a factor of volume and pressure, and is therefore increased in conditions of ventricular dilatation. It is also increased by arterial hypertension and aortic stenosis.
Heart rate
As heart rate affects cardiac output and therefore blood pressure, the mechanisms controlling it and blood pressure are integrated. Sympathetic activation increases heart rate and contractility, as increasing the rate alone would decrease diastolic filling time and therefore end-diastolic volume (preload).
Peripheral signals to the cardiovascular center include pressure and chemical sensors in the carotid and aortic bodies:
- Baroreceptor activation (by being stretched) results in vagal activation and bradycardia
- Chemoreceptor stimulation, for example via low O2 or glucose or raised CO2, also leads to bradycardia, though the effect is less direct.
48Hormones such as thyroxine and its metabolites increase heart rate. Extreme cold causes a reduction in heart rate, and higher body temperatures result in an increase in heart rate.
Total peripheral resistance
Total blood flow is also affected by total peripheral resistance (TPR), which is the sum force opposing blood flow, determined by the diameter of resistance vessels. This is dependent on vascular tone, the degree of smooth muscle contraction, and therefore constriction, of a vessel. Therefore global blood flow is also affected by changes in vascular tone. This is affected by innervations from the ANS and global hormones.
Vascular tone is also locally controlled by hormones and autoregulation – an intrinsic response of vascular muscle to maintain tone.
Vascular smooth muscle
Vascular smooth muscle contraction – like all muscle – involves Ca2+ release and the sliding filament model (see page 38). However, vascular contraction is slower and sustained compared to cardiac or skeletal muscle. It always has some degree of ‘tone’. Unlike cardiac muscle, it lacks the troponin complex and cells are not arranged into a striated pattern.
Contraction occurs in response to electrical, mechanical or chemical stimulation:
- Membrane depolarization
- Stretch
- Receptor binding
Stimulation causes Ca2+ influx from the extracellular space and Ca2+ release from sarcoplasms:
- Ca2+ binds to the protein calmodulin
- Ca2+-calmodulin complex activates myosin light chain kinase (MLCK)
- MLCK phosphorylates myosin light chains
- Actin–myosin crossbridges form and contraction occurs
Cycles of sliding filament contraction progressively shorten the myofibrils as long as intracellular Ca2+ remains high. Ca2+ ATPase and Na+ Ca2+ exchanger membrane proteins actively remove Ca2+.
Vascular tone
49Vascular tone is proportional to the intracellular Ca2+ concentration. This is influenced globally by autonomic control and hormones and locally by chemicals and intrinsic autoregulation.
Extrinsic control of vascular tone This is affected by external factors:
- Vasoactive chemicals in the blood
- ANS activity (which releases vasoactive chemicals)
- Variations in membrane receptors for afferent nerves or hormones.
Vasoactive chemicals Vasoactive compounds work via four main mechanisms: three different G-protein linked signal transduction pathways (Gq, Gs and Gi), and nitric oxide (Table 1.13). Nitric oxide is one of the few gas signaling molecules.
| ||||||||||||||||||||||||||||||||||||||||||
It is synthesized by endothelial cells – stimulated, for example by acetylcholine released by parasympathetic efferent neurons. It diffuses through vascular myocyte membranes to cause vasodilation.
51ANS activity Generally, sympathetic adrenergic activation (via α receptors) vasoconstricts systemic vessels to increase TPR and therefore blood pressure, and cholinergic activation (via muscarinic receptors) stimulates sweating and dilates skin arteries. Most blood vessels have very little parasympathetic innervation. At rest, vagal tone dominates in the heart, whereas sympathetic tone dominates in vascular smooth muscle.
Intrinsic control of vascular tone Autoregulation is the intrinsic response of arteriolar smooth muscle to changes in perfusion or blood constituents in order to moderate local blood flow. Different networks can have different responses due to receptor variation. For example, hypoxia in the pulmonary circulation causes vasoconstriction, to match ventilation and perfusion; elsewhere it induces vasodilatation in an attempt to correct the abnormality.
The myogenic response Increased blood flow/pressure activates stretch receptors, causing reflex vasoconstriction and a decrease in local flow. This myogenic response maintains constant flow despite fluctuating mean arterial blood pressure (Figure 1.31).
Metabolic adaptation Increased cellular metabolism produces metabolites that are vasodilators, thereby matching blood flow to metabolic demand. They include K+ ions, adenosine and CO2.

Figure 1.31: Myogenic autoregulation. Within the autoregulatory range a rise in pressure in the arterioles perfusing a tissue will cause reflex constriction, which increases resistance and maintains constant blood flow through the tissue.
Coronary blood flow
52Myocardium has a high metabolic rate, reflected in its large numbers of mitochondria, and receives a high blood flow via an extensive capillary network. It is the most efficient organ at extracting O2 from blood – about 70% that enters its circulation. Therefore, it relies on metabolic adaptation to match blood flow and O2 supply. Its resting blood flow of 200–250 mL/min can increase to 1 L/min during exercise.
Contrary to other organs, coronary blood flow is impeded during systole and enhanced during diastole, particularly on the more muscular left side. The transmural pressure generated by systole compresses subendocardial arterioles so that myocardium is not perfused. Some systolic perfusion does occur in the outermost (i.e. subepicardial) myocardium, where transmural pressure is lower.
Left coronary artery flow
The highest LCA flow occurs during diastole (Figure 1.32). The lowest is during the isovolumetric phases of systole, when ventricular pressure is high but coronary flow is low.
Right coronary artery flow
Right ventricular myocardial perfusion is more consistent as wall tension is much lower than in the left.
Coronary flow reserve
This is the ratio of maximal to resting flow velocity. It is reduced in patients with significant, flow-limiting CHD and in those with microvascular disease.
Velocity is measured with an intracoronary Doppler wire during coronary angiography. Maximal velocity is induced pharmacologically, usually with adenosine. The ratio is calculated as the hyperemic flow velocity divided by baseline velocity.
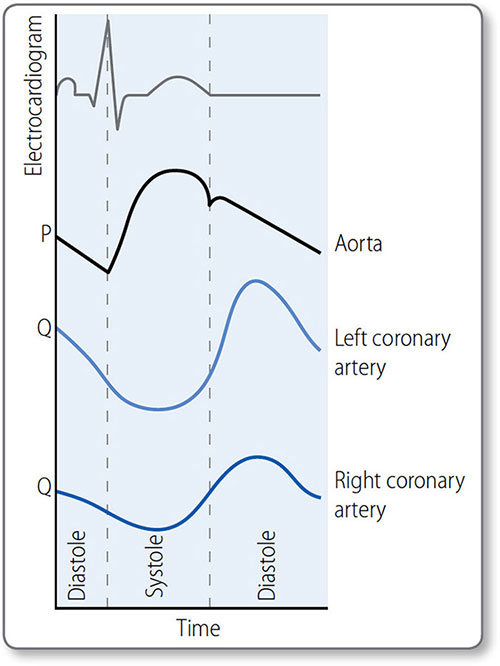
Figure 1.32: Coronary blood blow (schematic representation). Aortic pressure (P) peaks in systole; left coronary artery (LCA) flow (Q) peaks in diastole, due to high systolic resistance caused by compression of vessels in the ventricular wall. This effect is less in the right coronary artery (RCA) as right ventricular pressures are lower.
Hemodynamics
Hemodynamics is the study of physical laws governing blood flow.
Pressure, flow and resistance
The heart is an intermittent pump, generating pressure (P) to drive blood flow (Q) through the circulation against the force of resistance (R):
Δ P = QR
This can be rearranged:

i.e. an increase in driving pressure, or a reduction in resistance to flow both increase blood flow.
Applying this to the circulatory system:
- Flow (Q) is cardiac output (CO)
- The change in pressure (ΔP) is mean arterial pressure (MAP) minus central venous pressure (CVP)
- Resistance (R) is TPR

Cardiac output can be increased by increasing contractility (to generate higher MAP) or heart rate, but the main mechanism of regulation is via changes in peripheral vascular tone (i.e. TPR) as explained by Poiseulle's equation. Changes in arteriolar diameter are the main mechanism of controlling local blood flow.
Poiseuille's equation
This law relates to the influence of fluid viscosity (η), the length of tube (L) and its radius (r) on resistance:

Substituting in the previous resistance equation gives:

As blood viscosity and vessel length are relative constants, this simplifies to:
Q ∝ ΔP . r4
In effect, this means:
- Most peripheral resistance is due to arterioles, because of the small diameter
- Blood flow increases linearly with blood pressure and to the fourth power of vessel radius
- Therefore, very small changes in vessel radius profoundly affect resistance, e.g. doubling the radius increases flow 16-fold
Poiseuille's equation also defines how an increase in blood viscosity increases resistance and blood pressure.
Flow velocity
Flow velocity is the velocity of blood in centimetres per second in a vessel or group of vessels. Unlike the overall volumetric flow (measured in mL/min), flow velocity varies in different circulatory networks.
55It is inversely proportional to the cross-sectional area of the network (Table 1.14). The combined cross-sectional area of capillaries is very large. Consequently, slow capillary flow (<0.1 cm/s) allows time for exchange of nutrients, gases and waste between blood and cells.
Laminar and turbulent flow
Blood flow is normally laminar, i.e. concentric layers of fluid move parallel to the axis of the vessel (Figure 1.33). Vessel wall friction creates a gradient of velocity, with slower flow closer to the wall.
Turbulent, or disturbed, flow may occur if:
- Velocity increases as it goes through narrower spaces
- Viscosity reduces
- Vessel diameter increases.
Turbulent flow requires more pressure to achieve a given flow rate and is less efficient.
Blood pressure
Blood pressure is the force that blood exerts on vascular walls. It is measured in millimeters of mercury (mmHg), i.e. the number of millimeters by which it can raise a column of mercury in a manometer. In this section, blood pressure refers to systemic blood pressure, routinely measured with a sphygmomanometer at the brachial artery (see page 120).
|

Figure 1.33: Flow through blood vessels. (a) Laminar flow. Friction between the vessel wall and flowing blood causes a parabolic velocity profile with the highest flow velocity centrally and the slowest at the periphery. (b) Turbulent flow acceleration through narrowed segment causes flow separation and vortex formation in the poststenosis region.
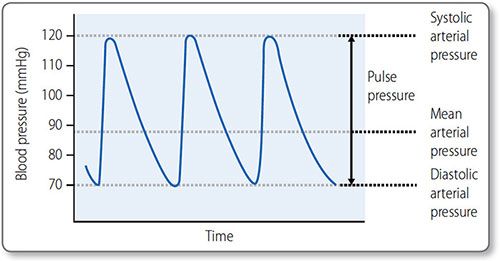
Figure 1.34: Systolic, diastolic and mean arterial blood pressure. The pulse pressure is the difference between the systolic pressure and the diastolic pressure.
Blood pressure is expressed as the systolic value over the diastolic value, for example 120/80 mmHg. Mean arterial pressure (MAP) is the average blood pressure over the period of the cardiac cycle (Figure 1.34).
57Maximum blood pressure is reached during systole, and the minimum occurs in diastole. Although the heart is an intermittent pump, blood pressure is maintained during diastole by elastic recoil of the large arteries (Figure 1.35). Blood pressure declines the more distal a vessel is from the left ventricle, as flow energy is lost via friction and resistance decreases.
Determinants of blood pressure
Blood pressure is the sum of the arterial and venous pressures. However, central venous pressure (CVP) is usually discounted as it is close to zero (normally 2–5 mmHg). Recall the following relationship:
Pressure (P) = flow (Q) × resistance (R)
Flow is equivalent to cardiac output and resistance equals TPR. Therefore:
MAP = stroke volume × heart rate × TPR
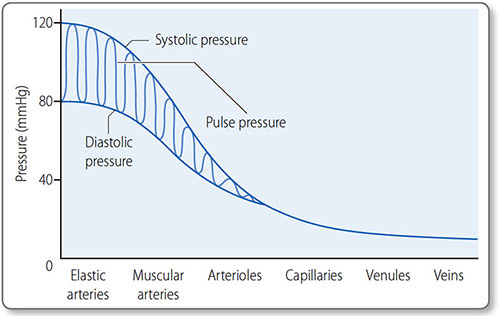
Figure 1.35: The first vessels in the arterial tree, the elastic and muscular arteries, transmit blood pressure with minimal loss. Through the arterioles there is a large fall in blood pressure and the pulse pressure falls until it is eventually lost.
58This shows that an increase or a decrease in stroke volume, heart rate or TPR will cause a corresponding increase or decrease in MAP. As stroke volume is closely related to blood volume, the major determinants of MAP are:
- TPR
- Cardiac output (stroke volume × heart rate)
- Blood volume
Systolic blood pressure is mainly determined by stroke volume and arterial compliance. Diastolic blood pressure is mainly determined by TPR.
Control of blood pressure
Blood pressure is regulated in the short term by the cardiovascular center of the ANS (Table 1.15). TPR is also affected by blood vessel autoregulation (see page 51) and the influence of hormones and vasoactive chemicals. Long-term regulation is via hormonal control of blood volume and vascular tone.
Short-term control
The medullary cardiovascular center co-ordinates fast homeostatic mechanisms to ensure tissues have sufficient O2, glucose and other essential metabolites (Figure 1.36).
|
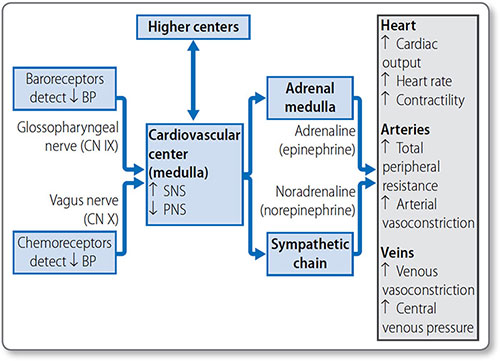
Figure 1.36: Short-term mechanisms of blood pressure control. A decrease in blood pressure is detected by baroreceptors and chemoreceptors. The cardiovascular center coordinates the response through activation of the sympathetic nervous system (SNS) and inhibition of the parasympathetic nervous system (PNS) to cause a compensatory increase in blood pressure.
Baroreceptors Stretch receptors of the aortic arch and carotid sinus send signals to the cardiovascular center via cranial nerves IX and X. An increase in the rate of baroreceptor action potential firing stimulates the PNS, and inhibits the SNS, to decrease blood pressure. A decrease in pressure has the opposite effect. This baroreflex system is rapid and modifiable (e.g. to accommodate exercise) but doesn't affect long-term control.
Chemoreceptors Chemoreceptors of the aortic arch and carotid bodies are sensitive to changes in blood O2, CO2 and pH. Their signals also travel in the IX and X cranial nerves to the medulla. They have a greater effect on the respiratory than the cardiovascular center.
60Chemoreceptors are activated by decreased O2 and pH and increased CO2, and cause an increase in vascular tone and decrease in heart rate. The bradycardic effect is concurrently overridden by sympathetic stimulation due to lung stretch receptor activation, so that the overall effect is an increase in heart rate, vascular tone and blood pressure.
Muscle receptors Muscle chemo- and stretch receptors activate the SNS during activity.
Influence of higher brain regions Higher brain regions can influence blood pressure homeostasis. For example, the amygdala and hypothalamus stimulate the fight-or-flight response to a perceived threat:
- Increased blood pressure, heart rate, breathing rate
- Pupil dilation
- Decreased digestion
- Diversion of blood to skeletal muscles
- Release of stored energy.
Hormones Short-term regulation of blood pressure is also influenced by the hormones adrenaline (epinephrine), angiotensin II (AT II), antidiuretic hormone (ADH) and atrial natriuretic peptide (ANP) (Table 1.16). The latter three are also important in long-term blood pressure regulation.
Long-term control
Long-term blood pressure regulation is largely via control of blood volume. This is modified by systems of Na+ and water reabsorption and excretion in the renal tubules (Figure 1.37).
Antidiuretic hormone Osmoreceptors in the hypothalamus sense fluctuations in serum osmolality, i.e. in how concentrated plasma is with electrolytes (particularly Na+). An increase in osmolality results in ADH secretion via the posterior pituitary. ADH causes:
|

Figure 1.37: Long-term blood pressure regulation through control of blood volume. The overall effect is a reflex increase in blood pressure by increasing both blood volume and total peripheral resistance.
- Peripheral vasoconstriction
- Thirst
- Increased aquaporin expression in cells of the distal renal tubule and collecting dust, resulting in increased water reabsorption.
This dilutes blood, and increases TPR and blood volume and therefore blood pressure.
Atrial natriuretic peptide Atrial myocardial cells release ANP in response to stretch, i.e. increased blood volume or venous return. ANP causes:
- Peripheral vasodilation
- Dilation of afferent and constriction of efferent glomerular arterioles to increase glomerular filtration rate (GFR)
- Reduced renal Na+ and water reabsorption
- Inhibition of the renin–angiotensin–aldosterone system (RAAS).
This decreases both TPR and blood volume, and therefore blood pressure.
Renin–angiotensin–aldosterone system (RAAS) RAAS is a hormonal cascade that increases TPR and blood volume to raise blood pressure (Figure 1.38).
Renin is an enzyme produced by granular cells of the renal juxtaglomerular apparatus (JGA). Release is stimulated by:
- Decrease in arterial blood pressure – detected by JGAFigure 1.38: The renin−angiotensin−aldosterone cascade.①1, Renin is released from the juxtaglomerular cells in response to low blood pressure. ②, Renin cleaves angiotensinogen into angiotensin I. ③, Angiotensin I is converted into angiotensin II by angiotensin-converting enzyme. ④, Angiotensin II stimulates aldosterone release from the adrenal cortex.
- SNS stimulation to the JGA.

Renin converts plasma angiotensinogen produced by liver cells into angiotensin (AT). AT is subsequently converted by angiotensin-converting enzyme (ACE) into AT II. AT II causes:
- Powerful vasoconstriction
- Increase in renal Na+ and water reabsorption
- SNS stimulation
- Aldosterone release
- ADH release.
Aldosterone is a mineralocorticoid hormone that, like ADH, increases renal Na+ and water reabsorption at the DCT and collecting ducts.
Hemostasis
Blood is a water-based fluid that distributes metabolic nutrients, gases and waste products as well as blood cells and many proteins (Table 1.17).
Hemostasis is a sequence of events that prevents blood loss from damaged vessels and is the start of wound healing. It has three stages:
- Vasoconstriction
- Platelet aggregation forming a ‘platelet plug’
- The coagulation cascade forming a fibrin clot.
The end result is a thrombus; a collection of platelets, dead (predominately red) cells and a matrix of the protein fibrin. Platelet aggregation is quicker but weaker than the fibrin deposition of the cascade and is of greater importance in high-flow, arterial vessels – forming paler, platelet-rich ‘white clots’. Fibrin deposition occurs more in low-flow venous vessels, resulting in fibrin and erythrocyte-rich ‘red clots’.
Vasoconstriction
Injury to a blood vessel results in vasoconstriction to limit blood loss. Constriction is triggered by:
| |||||||||||||||||||||||||||||||||||||||||||
- A direct vascular smooth muscle cell response
- Endothelial cell release of vasoconstrictive mediators
- Local pain reflexes.
Platelet aggregation
Platelets are anuclear fragments of megakaryocytes produced in the bone marrow. They are continually produced and last for 10–12 days. Platelets contain vesicles (granules):
- α-granules: clotting factors, inflammatory mediators and growth factors
- Lysosymes
A number of platelet agonists trigger specific pathways of platelet activation, resulting in activation of the GPIIb/IIIa complex. Platelet aggregation is initiated by exposure to subendothelial components in the extracellular matrix (ECM). von Willebrand factor (vWF), a circulating protein, binds to both ECM collagen and to platelet surface glycoprotein GpIb (Figure 1.39). This results in translocation of glycoprotein complex IIb/IIIa (GpIIb/ IIIa) to the platelet surface. Platelets aggregate by bonding via GpIIb/IIIa complexes.
Platelet activation
Platelets are activated to release their secretory vesicles (i.e. degranulate) by:
- Adenosine diphosphate (ADP)
- Thrombin, an enzyme of the coagulation system
- Calcium
- Thromboxane A2, a lipid signalling molecule.
Degranulation promotes aggregation, further platelet activation, the coagulation cascade and inflammation. Conversely, prostacyclin release by endothelial cells and leukocytes inhibits platelet aggregation and their release from the bone marrow.
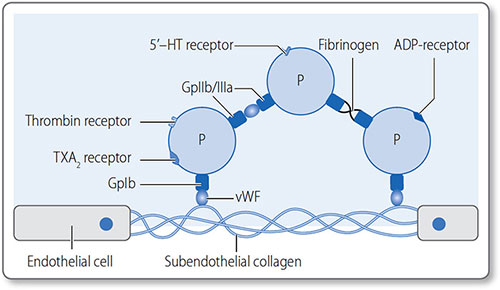
Figure 1.39: Platelets constitutively express GpIb on their surface, but once activated they express GpIIb/ IIIa, which mediates strong bonds between them. Gp, glycoprotein; P, platelet; TXA2, thromboxane; vWF, von Willebrand factor.
The coagulation cascade
66The coagulation cascade is a series of amplifying reactions of clotting factors resulting in fibrin clot formation (Figure 1.40). Clotting factors are soluble pro-enzymes (e.g. factor X or FX) present in circulation that are cleaved to become active enzymes (e.g. FXa).
The reactions of the coagulation system often take place on the surface of platelets and require Ca2+ as a co-factor. The cascade can be initiated by endothelial damage (the extrinsic pathway) or intrinsic to ongoing hemostasis (the intrinsic pathway).

Figure 1.40: Activation of the coagulation of clotting cascade occurs via the extrinsic or intrinsic pathways, but both converge on generation of thrombin, which forms an insoluble fibrin mesh.
The extrinsic pathway
67Endothelial damage exposes tissue factor (TF), which binds factor VII (FVII), activating factor VII to FVIIa–TF. This complex activates FX, which associates with its co-factor, FV, to form FXa–FVa (a small amount of active FV is present spontaneously). FXa–FVa converts prothrombin (FII) into thrombin (FIIa), which cleaves soluble, circulating fibrinogen – the soluble precursor of fibrin – into insoluble fibrin. Only a small clot is formed, but the intrinsic pathway is activated to form a full fibrin clot.
Thrombin produced by the extrinsic pathway activates:
- FV
- FVIII (by cleavage from circulating FVII–vWF complexes)
- FXI
- Platelets
The extrinsic pathway is rapidly terminated by the extrinsic pathway inhibitor (EPI) that blocks activation of FX by FVIIa–TF.
The intrinsic pathway
This is triggered by thrombin generated by the extrinsic pathway or from platelet degranulation. FIXa–FVIIIa complexes activate FX, which is able to generate large amounts of thrombin and therefore a fibrin clot.
Thrombolysis
Thrombolysis (or fibrinolysis) is the process of cleaving insoluble fibrin into soluble degradation products, to remove clots (Figure 1.41). This limits thrombus size, allows remodeling and breaks the thrombus down once the causative damage has been repaired.
Cleavage is mediated by plasmin, which circulates as inactive plasminogen and is activated by tissue plasminogen activator (tPA). Endothelial cells release tPA in response to the presence of thrombin.
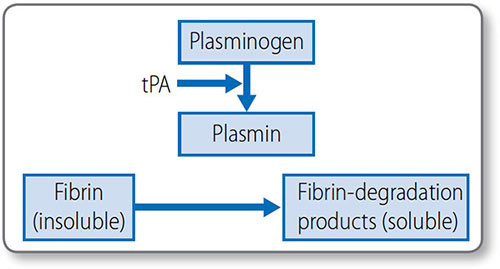
Figure 1.41: Mechanism of thrombolysis plasmin breaks down insoluble fibrin into soluble degradation products. tPA, tissue plasminogen activator.
Anti-coagulation systems
The body has several systems to prevent unnecessary activation of the coagulation cascade:
- Antithrombins (e.g. antithrombin III) inhibit thrombin and other active clotting factors, blocking progression of the cascade
- Heparin works by activating antithrombin III, making it rapidly effective
- The protein C system. In response to the presence of thrombin, thrombomodulin is expressed on the surface of intact endothelial cells. Circulating protein C and its co-factor protein S bind to thrombomodulin and break down FVa and FVIIIa.
Lipid metabolism
Lipid molecules contain carbon, hydrogen and oxygen, and principally consist of non-polar carbon–hydrogen (C–H) bonds. They are consumed in the diet and synthesized de novo. Lipids can be hydrolyzed to yield fatty acids or complex alcohols, which are important energy fuels for cellular metabolism.
They are a diverse group of substances with diverse chemical structures and functions (Table 1.18).
|
Polarity
Lipids have a hydrophobic tail group which is non-polar, and makes them soluble in organic solvents and insoluble in water. Some lipids also contain other polar groups that make them amphiphilic (amphipathic), i.e. they have both polar, soluble, water-loving (hydrophilic) and non-polar, fat-loving (lipophilic) properties. Amphiphilic lipids have important biological functions, for example phospholipids constitute the lipid bilayer structure of cell membranes.
Lipolysis
Lipids are hydrolyzed to fatty acids and glycerol in adipose and muscle tissues when energy is required.
- Fatty acid co-linkage to coenzyme A Fatty acids are first activated in the cytosol when they are bound by a coenzyme A (CoA). This is catalyzed by acyl CoA synthetase and is irreversible.Step 1: fatty acid + ATP → acyl adenylate + pyrophosphateStep 2: acyl adenylate + CoASH → acyl CoA + AMPA thioester bond is formed between the fatty acid carboxyl group and the sulfhydryl group of CoA.
- The carnitine shuttle Acyl CoA can only enter mitochondria via the carnitine shuttle. Carnitine is a nitrogenous cation that binds to acyl CoA to form acylcarnitine. This is able to cross the outer and inner mitochondrial membranes in exchange for unbound carnithine moving out of mitochondria. This is the rate-limiting step in fatty acid oxidation.
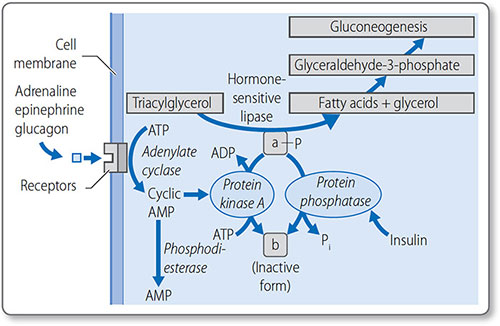
Regulation of lipolysis
Lipolysis is regulated through the control of lipase activity (Figure 1.42). Counter-regulatory hormones stimulate lipase when energy reserves are low: adrenaline (epinephrine), noradrenaline (norepinephrine), growth hormone, cortisol and glucagon. Conversely, insulin inhibits lipase.
Fatty acid oxidation
Fatty acids are oxidized by β-oxidation in mitochondria and peroxisomes to generate acetyl CoA, NADH and FADH2. Acetyl-CoA enters the citric acid cycle and the latter act as oxidizing co-factors in the electron transport chain. Each FADH2 and NADH generates two and three molecules of ATP, respectively.
Before oxidation, unsaturated fatty acids must have their double bonds broken by isomerase and reductase enzymes.
Glycerol
Glycerol is a 3-carbon polyol (sugar alcohol) with three hydroxyl groups, and is the backbone of all triglyceride lipids. Once converted to glyceraldehyde-3-phosphate, it can enter glycolysis or gluconeogenesis in the liver. Alternatively, it can be used as a substrate for triacylglycerol or phospholipid synthesis in the liver and adipose tissue.
Lipogenesis
Fatty acids synthesis is the production of palmitic acid from acetyl CoA and malonyl CoA. It occurs in the liver, lactating mammary glands and adipose tissue if dietary intake is insufficient. There are four stages, the later three occurring in the cytosol:
- Acetyl CoA synthesis and the citrate shuttle
- Malonyl CoA synthesis
- Formation of malonyl transferase
- The fatty acid elongation cycle.
72Palmitic acid is a 16-carbon fatty acid and the most abundant in the body. It is the starting point for all fatty acids. It normally exists dissociated from its H+ ion as palmitate ion.
Acetyl coenzyme A synthesis
Acetyl CoA is synthesized from pyruvate by pyruvate dehydrogenase and by mitochondrial β-oxidation of fatty acids.
The citrate shuttle Acetyl CoA is transported from mitochondria to the cytosol as citrate:
- Acetyl CoA reacts with oxaloacetate to form citrate
- Tricarboxylate translocase transports citrate to the cytosol
- Citrate is cleaved back to oxaloacetate and acetyl CoA in the cytosol by an ATP-dependent enzyme called ATP-citrate lyase.
This requires 14 NADPH as reducing agents, and produces 8 for every molecule of palmitate produced. The pentose phosphate pathway provides the deficit.
Malonyl coenzyme A synthesis
Some acetyl CoA is carboxylated to form malonyl CoA in an irreversible two-step reaction that requires bicarbonate, biotin and ATP. It is a commitment step in fatty acid synthesis, as malonyl CoA is only involved in fatty acid synthesis.
Both steps are catalyzed by acetyl CoA carboxylase:
- Acetyl CoA is converted to carboxybiotin; one ATP is used
- The carboxyl group is transferred from the biotin to the acetyl CoA to form malonyl CoA.
This is the key regulatory step for fatty acid synthesis (see page 74). The ‘extra’ carbon of malonyl CoA is what allows lipogenesis to be thermodynamically possible.
Fatty acid synthase
Fatty acid synthase is a dimeric, 7-enzyme complex that synthesizes palmitic acid from either acyl CoA or malonyl CoA. Each domain is responsible for different steps of synthesis (Table 1.19).
Firstly, acetyl CoA or malonyl CoA attach to an oxygen atom of acetyl transferase or malonyl transferase, respectively. Acetyl groups are transferred to the condensing enzyme β-ketoacyl synthase. Malonyl groups are then transferred to the acyl carrier protein.
|
The two carbons of the malonyl group attached to the acyl carrier protein are elongated by a cycle of condensation and reduction reactions to form 16-carbon palmitoyl. Finally, this is hydrolyzed to palmitate. The stoichiometry can be summarized as:
8 acetyl CoA + 7 ATP + 14 NADPH + 6 H+
↓
Palmitate + 14 NADP+ + 8 CoA + 6 H2O + 7 ADP + 7 Pi
Further elongation
Longer fatty acids are synthesized by microsomes – vesicles of 74budded endoplasmic reticulum. Two carbon units are added to the carbonyl end of saturated and unsaturated fatty acids. Solubility rapidly decreases as chain length increases.
Unsaturation of fatty acids
Microsomal enzymes also add double bonds to unsaturate long chain acyl CoAs, such as cnverting stearoyl CoA to oleoyl CoA. An oxidase enzyme introduces a cis-Δ9 double bond, and requires O2 and NADH, and releases two molecules of water.
Regulation of fatty acid metabolism
Fatty acid metabolism is predominately regulated by hormones that affect acetyl CoA carboxylase activity (Figure 1.43):
- When energy is required, adrenaline (epinephrine) and glucagon inactivate it via phosphorylation by AMP protein kinase
- When energy is not required, insulin activates it via dephosphorylation by phosphatase 2A.
Acetyl CoA carboxylase is also activated by citrate and inhibited by AMP and palmitoyl CoA.
Lipogenesis is tightly coordinated with fatty acid breakdown, i.e. β-oxidation (Table 1.20).
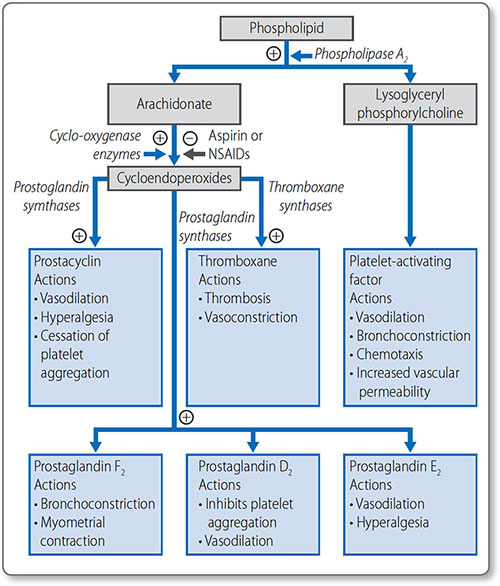
Prostaglandins
Arachidonate is a 20-carbon polyunsaturated fatty acid derived from linoleate. It is the starting point for the basis of the prostaglandins: prostacyclins, thromboxanes and 75leukotrienes (Figure 1.44). These locally acting hormones have a short half-life but have vital functions, including:
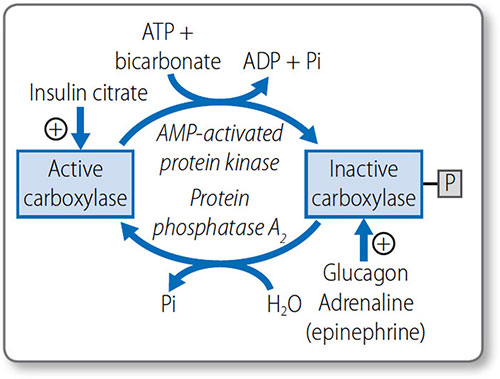
Figure 1.43: Regulation of acetyl coenzyme A carboxylase activity. +, activates; P, phosphate; Pi, inorganic phosphate.
|
- Stimulating the inflammatory response
- Regulating local blood flow
- Propagating synaptic transmission
- Sleep induction.
Cholesterol metabolism
Cholesterol is a 27-carbon steroid alcohol (sterol) lipid (Figure 1.45). It is a key component of cell membranes, allowing their fluid movement, and is the precursor to vitamin D, bile acids and steroid hormones, including testosterone and cortisol.

Cholesterol is consumed in the diet and synthesized de novo in the liver and intestine. On average, 800 mg of cholesterol is synthesized daily in a person on a low-cholesterol diet.
Cholesterol synthesis
Cholesterol biosynthesis begins with formation of isopentenyl pyrophosphate from acetyl CoA (Figure 1.46). The first step is the condensation of acetyl CoA with acetoacetyl CoA, forming 3-hydroxy-3-methylglutaryl CoA (HMG-CoA), a reaction catalyzed by HMG CoA synthase.
Formation of mevalonate HMG-CoA, which is present in the cytosol and mitochondria of the liver, is reduced to mevalonate by HMG-CoA reductase. This reaction requires NADPH. This is the first irreversible, committed step of cholesterol synthesis. Mevalonate is then converted to isopentenyl pyrophosphate in a series of three ATP-dependent reactions.
Synthesis of squalene The second stage of cholesterol synthesis is the synthesis of squalene, a 30-carbon hydrocarbon molecule, from five five-carbon molecules of isopentenyl pyrophosphate.
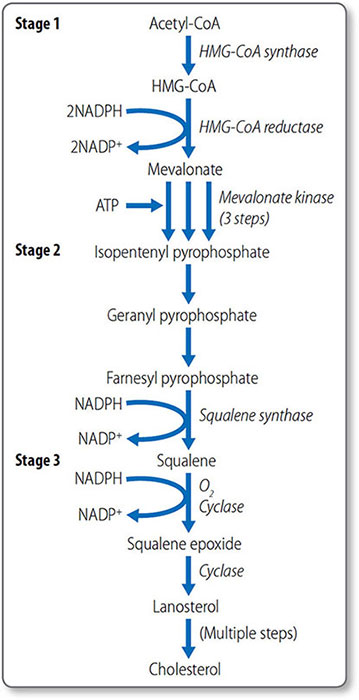
Figure 1.46: Biosynthesis of cholesterol. HMG-CoA, 3-hydroxy-3-methylglutaryl CoA. NADPH, nicotinamide adenine dinucleotide phosphate; ATP, adenosine triphosphate.
This process starts with the isomerization of isopentenyl pyrophosphate to form dimethylallyl pyrophosphate.
Formation of squalene epoxide The third stage is the cyclization of squalene to form squalene epoxide. This requires O2 and NADPH. Squalene epoxide then undergoes cyclization to lanosterol in a reaction catalyzed by cyclase. Lanosterol is then converted to cholesterol, a 27-carbon molecule, by the removal of three methyl groups and the reduction of a double bond by NADPH.
79Regulation of cholesterol synthesis Cholesterol synthesis is regulated by mechanisms that sense the cellular level of cholesterol and modify HMG CoA reductase levels and activity:
- Sterol regulatory element: a transcription factor that inhibits enzyme gene expression in the presence of sterols
- Non-sterol metabolites: derivatives of mevalonate inhibit enzyme gene expression
- AMP-activated protein kinase: phosphorylates and decreases enzyme activity when ATP levels are low
- Enzyme degradation is also tightly regulated.
Cholesterol absorption
Cholesterol esters in the gut are hydrolyzed by cholesterol esterases, secreted by the pancreas and small intestine, to free cholesterol. Cholesterol must be emulsified to be absorbed: conjugated bile acids form micelles with free cholesterol, fatty acids, monoglycerides, and phospholipids.
Most cholesterol is absorbed in the middle jejunum and terminal ileum through the transmembrane transporter protein Niemann–Pick C1-like 1 protein. 30–60% of dietary cholesterol is absorbed daily. Once absorbed into the intestinal mucosa cell, it is packaged into large lipoproteins called chylomicrons.
Cholesterol esterification
As free cholesterol is cytotoxic, it is esterified in the liver to cholesterol ester by acyl cholesterol acyl transferase. Cholesterol esters are stored in intracellular lipid drops and constitute 70% of plasma cholesterol.
Esterification requires energy-dependent activation of a fatty acid with CoA to form an acyl CoA. The acyl CoA reacts with a hydroxyl group on cholesterol to form an ester.
80Lipoprotein esterification Esterification also occurs in the blood, in lipoproteins, the lipid transport vesicles. This is catalyzed by lecithin-cholesterol acyl transferase and does not require CoA; instead a fatty acid is transferred from lecithin. The enzyme is activated by apolipoprotein A-I, the major apolipoprotein in high density lipoprotein (HDL). Cholesterol esters are in the hydrophobic core of the lipoprotein molecule (Table 1.21).
Lipid absorption and transport: lipoproteins
Lipoproteins are spherical particles with non-polar neutral lipids in their core (i.e. triglycerides and cholesterol esters) and more polar amphipathic lipids (i.e. phospholipids and cholesterol) on their surface (Figure 1.47). They also have apolipoproteins on their surface, which bind lipids, cell receptors and act as co-factors for enzymes of lipid metabolism (Table 1.22).
Types
Lipoproteins are classified by their physiochemical properties (Tables 1.21 and 1.23). Generally, larger lipoproteins contain more core lipids, triglycerides and cholesterol esters, and less protein.
Pathways
Lipoprotein metabolism has four main pathways with discrete functions in lipid transport.
|
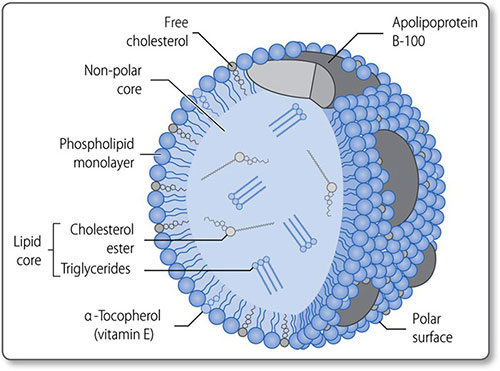
- The exogenous pathway
- The endogenous pathway
- Intracellular cholesterol transport
- Reverse cholesterol transport.
The exogenous pathway
The exogenous lipoprotein pathway transports lipids absorbed by the intestine to the liver and peripheral cells (Figure 1.48).
- Chylomicrons are assembled in the endoplasmic reticulum of endocytes by combining triglycerides with apolipoprotein B-48
- They are secreted into the circulation, where they acquire additional lipoproteins (e.g. apolipoproteins E and CIIII) from HDL
- Apolipoprotein C-II activates lipoprotein lipase on the luminal surface of endothelial cells, which hydrolyzes chylomicrons to free fatty acids
- The free fatty acids are either taken up by adipose tissue and stored as triglycerides or taken up by muscle and used as an energy source.
|
Remnant particles Chylomicrons are progressively hydrolyzed to chylomicron remnant particles. The surplus phospholipids and apolipoprotein A-I, are transferred back to HDL. Remnant particles are taken up by the liver through via hepatic apolipoprotein E and B-48 receptors. The triglycerides returned to the liver are used to power the biosynthetic activity of the liver, or they are repackaged with apolipoprotein B100 and secreted as very-low-density lipoprotein (VLDL) particles.
The endogenous pathway
This pathway transfers triglycerides synthesized by/transferred to the liver to peripheral cells for energy metabolism (Figure 1.49).
|
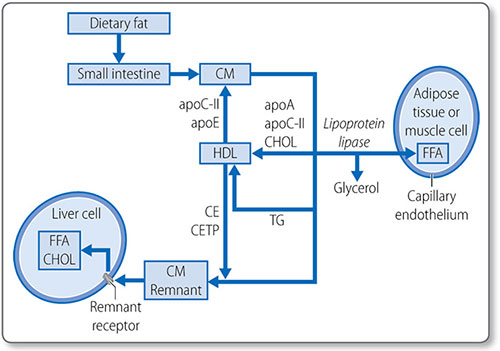
Figure 1.48: The exogenous lipoprotein pathway. apo, apolipoproteins; CE, cholesteryl ester; CETP; cholesteryl ester transfer protein; CHOL; cholesterol; CM, chylomicrons; FFA, free fatty acids; HDL, high-density lipoprotein; IDL, intermediate-density lipoprotein; TG, triglycerides; VLDL, very-low-density lipoprotein.
Lipoproteins in the endogenous pathway contain apolipoprotein B-100, particularly VLDLs, which also contain apolipoprotein E and apolipoprotein C. The apolipoprotein C-II on the surface of VLDLs activates lipoprotein lipase on the surface of endothelial cells, which hydrolyze triglycerides to glycerol and fatty acids. The progressive hydrolysis of triglycerides in the core of a VLDL particle transforms it into intermediate density lipoprotein and eventually LDL.
About half of the apolipoprotein B100 particles in the exogenous pathway are removed by hepatic remnant receptors before undergoing complete hydrolysis. The remaining portion is converted to LDL. The triglyceride in LDL is further depleted by the cholesteryl-ester transfer protein, a plasma enzyme that removes triglycerides from LDL in exchange for cholesterol esters from HDL. During the transformation from VLDL to LDL, excess surface phospholipid and lipoproteins (except apolipoprotein B-100) are transferred to HDL.
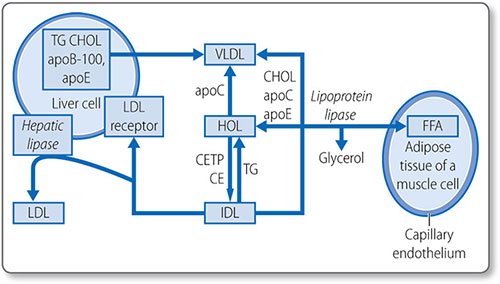
Figure 1.49: The endogenous lipoprotein pathway. apo, apolipoproteins; CE, cholesteryl ester; CETP; cholesteryl ester transfer protein; CHOL; cholesterol; CM, chylomicrons; FFA, free fatty acids; HDL, highdensity lipoprotein; IDL, intermediate-density lipoprotein; LDL, low-density lipoprotein; TG, triglycerides; VLDL, very-low-density lipoprotein.
Most LDL is returned to the liver through the LDL apolipoprotein B-100 receptor. The cholesterol can then be:
- Incorporated into lipoproteins
- Used in bile salt syntheses
- Excreted in bile.
Intracellular cholesterol transport
The intracellular transport of cholesterol is tightly regulated (Figure 1.50), as cholesterol affects membrane properties and is cytotoxic in excess.
Cellular cholesterol is derived from cellular synthesis, or through lipoprotein uptake via the LDL receptor. Receptor binding leads to lipoprotein endocytosis and lysosomal breakdown.
Apolipoproteins are degraded to small peptides and amino acids. Cholesterol esters are converted to free cholesterol by lysosomal acid lipase. Cholesterol is:
- Used for membrane biogenesis
- Stored in intracellular lipid drops after re-esterification
- Excreted in the reverse cholesterol transport pathway.
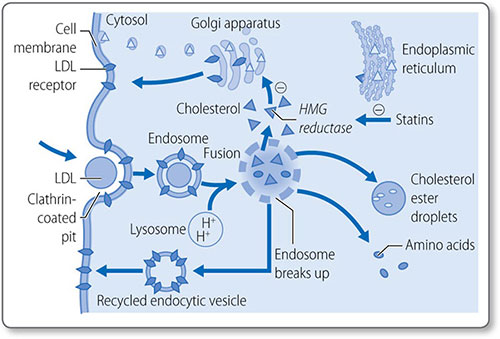
Figure 1.50: Overview of intracellular cholesterol transport. LDL, low-density lipoprotein. HMG CoA, 3-hydroxy-3-methylglutaryl CoA.
Regulation Excess intracellular cholesterol has a negative feedback effect on its own biosynthesis via HMG CoA reductase and LDL receptor down-regulation. It also induces the synthesis of proteins of the reverse cholesterol transport pathway.
Reverse cholesterol transport
This removes excess, potentially toxic, cellular cholesterol and transfers it to the liver for excretion (Figure 1.51). The main lipoprotein involved is HDL.
Cholesterol is actively pumped out of cells by the ATP-binding cassette transporter 1 (ABCA1) on to apolipoprotein A-I, which binds to cells to form nascent HDL.
Lecithin cholesterol acyl transferase is important in reverse cholesterol transport, as esterification produces the more hydrophobic cholesterol esters that remain trapped in the HDL core, until they reach the liver.
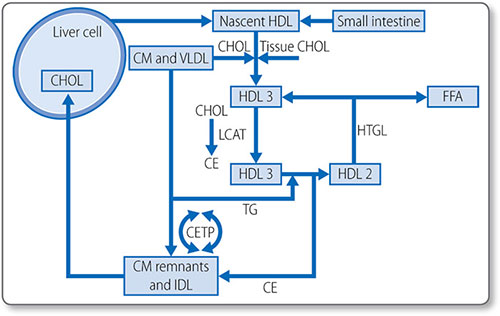
Figure 1.51: The reverse cholesterol transport lipoprotein pathway. CE, cholesteryl ester; CETP, cholesteryl ester transfer protein; CHOL, cholesterol; CM, chylomicrons; FFA, free fatty acids; HDL, high-density lipoprotein; HTGL, hepatic triglyceride lipase; IDL, intermediate-density lipoprotein; LCAT, lecithin-cholesterol acyltransferase; TG, triglycerides; VLDL, very-low-density lipoprotein.
The liver selectively removes some of the cholesterol esters, to allow the lipid-depleted HDL to return to the circulation for further rounds of cholesterol removal.
The cholesteryl-ester transfer protein is also key, as it allows a large portion of cholesterol removed from HDL to transfer to LDL as cholesterol esters, which are then removed by hepatic LDL receptors.