

Structural optical coherence tomography
Conventional structural optical coherence tomography (OCT) is based on reflectance signal backscattered from tissue structures. The reflectance signal provides information on variations in intrinsic tissue reflectivity on a microstructural level, but is also affected by shadowing, pupil vignetting, media opacity, defocus, incidence angle, and other factors that affect the signal strength.
Optical coherence tomographic angiography
Optical coherence tomographic angiography (OCTA) methodology has evolved over the past decade. It is a functional extension of OCT, which allows for the visualization of both transverse and axial flow in blood vessels down to the capillary level. OCTA images display flow signal instead of reflectance signal. The flow signal is computed based on the variation of the speckle pattern between a series of consecutive OCT B-scans. The speckle pattern could be analyzed in terms of amplitude, phase, or complex signals.
Split-spectrum amplitude-decorrelation angiography
Recognising that speckle patterns in different spectral (wavelength) bands contain independent flow information, the split-spectrum amplitude-decorrelation angiography (SSADA) algorithm1 spectrally splits each B-scan into multiple image frames for the purpose of flow signal calculation. SSADA has been show to improve the signal-to-noise ratio of flow detection by up to a factor of 4, using only 2 consecutive B-scans at each location to obtain high-quality angiograms.2
Relationship between decorrelation and velocity
Optical coherence tomographic angiography is sensitive to both axial and transverse flow, with a slightly higher sensitivity for the axial component. The decorrelation value increases monotonically with higher flow velocity. The relationship is nonlinear, with the decorrelation value reaching an upper limit beyond a saturation velocity. For the typical OCTA scan pattern, the inter-B-scan time ranges between 2 and 10 milliseconds, and saturation occurs in larger retinal and choroidal vessels.3 Even in capillaries, it is difficult to measure flow velocity using OCTA because the OCT beam's focal spot diameters are typically larger than the capillary width, causing the decorrelation value to vary with capillary width as well as flow velocity.
Cross-sectional and en face OCTA
Optical coherence tomographic angiography data takes the form of 3-dimensional (3D) volumes containing both reflectance and flow signals. This could be display in cross sections or en face slabs. Cross-sectional OCTA typically displays vascular flow in colour and nonvascular reflectance in grey scale. En face OCTA is usually generated by maximum flow projection, where the highest flow signal value over the axial range of the slab is used for display. The slabs are based on tissue boundaries identified by image segmentation software. They should ideally enclose a single plexus or several adjacent plexuses. Slabs could 4also be designed to optimize the detection of abnormal blood vessels in normally avascular layers.
Retinal plexuses
Projection-resolved OCTA1 shows there are up to four retinal plexuses (depending on location), which could be organized into two complexes (Figure 1). The boundary between the superficial and deep vascular plexuses lies in the middle of the inner plexiform layer (IPL). The earliest OCTA software incorrectly divided the retinal circulation into the superficial and deep plexuses at the junction between the IPL and the inner nuclear layer (INL), which would split the IPL and cause vessel density measurements to be highly sensitive to segmentation errors. The correct segmentation boundaries should be used going forward.
OCTA artifacts
Bulk motion causes artifactual flow signal that appears as bright line artifacts on en face OCTA. Bulk motion artifacts could be reduced using real-time tracking during acquisition,4,5 post-processing registration,6 and post-processing subtraction algorithms (Figures 2a to c).7 Flow projection artifacts (Figures 3a to c) are the result of flickering shadows cast by flowing blood in superficial vasculature that causes reflectance variations in deeper layers, which are then detected as a flow signal by the OCTA algorithm. The artifact manifests as tails below blood vessel on cross-sectional OCTA and the replication of superficial vascular pattern on en face OCTA of deeper slabs. Projection-resolved OCTA (PR-OCTA) uses a post-processing algorithm to resolve the ambiguity between flow signal due to in-situ flow (real vessels) and projected flow, thereby removing tails and providing clean visualization of vessels in deeper slabs.8 The OCTA flow signal is also dependent on reflectance signal strength on a log-linear fashion7 and thus vessel density measured from OCTA images with low signal strength could be artifactually decreased, unless compensation were made.9 Shadows from iris vignetting, cataract, and vitreous floaters could cause artifactual retinal and choroidal perfusion defects on OCTA.


Figure 1: Anatomic localization of vascular plexuses in the human retina in the macula, and current and proposed optical coherence tomography angiography segmentation boundaries. Cross-sectional projection-resolved optical coherence tomography angiograms (PR-OCTA) of a normal eye. Flow signals (purple for retinal and red for choroidal blood flow) were overlaid on reflectance signal (grey scale).
The ICP exists between the IPL and INL. The DCP exists between the INL and OPL. The GCLP/ICP boundary lies in the middle of the IPL and the ICP/DCP boundary lies in the middle of the INL.
(ILM, inner limiting membrane; NFL, nerve fibre layer; GCL, ganglion cell layer; IPL, inner plexiform layer; INL, inner nuclear layer; OPL, outer plexiform layer; ONL, outer nuclear layer; NFLP, NFL plexus; GCLP, GCL plexus; ICP, intermediate capillary plexus; DCP, deep capillary plexus; SVC, superficial vascular complex; DVC, deep vascular complex)
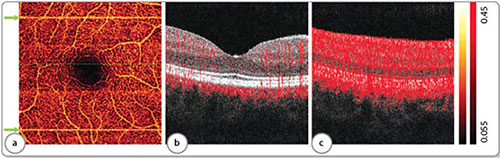
Figure 2: Examples of bulk motion artifacts. (a) En face inner retinal angiogram. Two bright lines in the image are the result of microsaccades (green arrows), disrupting vessel continuity. (b) Typical cross-sectional angiogram [from the green, dotted line in panel (a) without motion artifact]. (c) Cross-sectional angiogram at the position of the larger microsaccade shows high flow signal at all reflective structures.

Figure 3: Examples of projection artifacts. (a) Cross-sectional angiogram showing tails trailing beneath vessels (green arrows). (b) Inner retinal angiogram. (c) Outer retinal angiogram shows projection of the inner retinal vasculature.
And shadows from drusens could cause artifactual choroidal defects on OCTA (Figures 4a to c). Care should be taken to distinguish capillary dropout from shadow artifacts.
OCTA parameters quantifying perfusion and ischemia
The flow index is calculated as the average flow signal value in the region of interest on an en face OCTA.10 The vessel area density is calculated as the percentage area occupied by vessels in the selected region.11 The vessel length density is the length of the vascular network divided by the area of interest in units of mm-1.12 It is calculated from skeletonized en face OCTA. The avascular area or nonflow area sums abnormally large gaps between flow pixels on an en face angiogram.13 Nonperfusion or capillary dropout area refers to an avascular area that should normally be vascular.14,15 For example, on an OCT angiogram of the macula, any retinal avascular area outside of the FAZ is considered retinal nonperfusion area.
Quantification of neovascularization
In proliferative diabetic retinopathy, neovascular membrane is measured in the preretinal vitreous slab. In age-related macular degeneration, neovascularization is measured in the outer retinal slab after the removal of projection 6artifacts. On the en face angiogram, lesion or membrane area measures the area occupied by both the flow pixels (vessels) and the intervening nonflow pixels (fibrous tissue).16 The vessel area only counts the flow pixels (Figures 5a to c).17

Figure 4: Examples of shadow artifacts. (a) Cross-sectional angiogram showing shadow artifacts caused by drusens (green arrows). (b) Inner retinal angiogram. (c) Choriocapillaris angiogram shows artifactual flow defects (black area in the middle).

Figures 5: An example to show the quantification on neovascularization in age-related macular degeneration. (a) Choroidal neovascularization (CNV, yellow) overlaid by inner retinal vasculature (purple). (b) CNV membrane area (white) delineated automatically. (c) CNV vessel area showing flow pixels only.
Optovue angiovue technology
The AngioVue OCTA system Avanti (Optovue, Inc., Freemont, CA) is a high-speed (70 kHz) spectral-domain OCT system. Using the efficient SSADA algorithm, each standard OCTA volume is acquired in 3 seconds. Two image volumes are registered and merged using the patented motion correction technology (MCT) to minimise motion artifacts and improve image quality.6,18 The AngioAnalytics software maps and measures vessel density and nonflow area to measure ischemia, and vessel area to quantify neovascularization. Video tracking and high-definition (400 × 400) OCTA have been recently added to further improve image quality.
Clinical applications of OCTA technology
Optical coherence tomographic angiography uses intrinsic motion contrast to detect flow, and therefore does not require injection of a contrast agent like conventional fluorescein angiography (FA). The noninvasive nature of OCTA allows for routine use to detect disease and monitor treatment efficacy. Therefore, OCTA is likely 7to be used more than FA ever was. OCTA does not detect dye leakage or staining, therefore the recognition of abnormal vessels such as retinal or choroidal neovascularization is based on their distinct patterns and occurrence in normally nonvascular layers. Because OCTA is 3D, it is possible to separately visualise retinal vascular plexuses and choroidal layers by en face projection of segmented slabs. In diabetic retinopathy, retinal venous occlusion, and other retinal vascular diseases, OCTA is used to detect and quantify retinal neovascularization and ischemia (increased avascular area and decrease vessel density).19 In age-related macular degeneration, inherited retinal degenerations, and other outer retina/choroidal diseases, OCTA is used to detect and quantify choroidal neovascularization and choriocapillary defects.11,20,21 In glaucoma and other optic neuropathies, OCTA is used to detect decreased perfusion in the optic disc, peripapillary retina and choroid, and macular ganglion cell complex.22-24
References
- Jia Y, Tan O, Tokayer J, et al. Split-spectrum amplitude-decorrelation angiography with optical coherence tomography. Opt Express 2012;20:4710–4725.
- Gao SS, Liu G, Huang D, et al. Optimization of the split-spectrum amplitude-decorrelation angiography algorithm on a spectral optical coherence tomography system. Opt Lett 2015;40:2305–2308.
- Su JP, Chandwani R, Gao SS, et al. Calibration of optical coherence tomography angiography with a microfluidic chip. J Biomed Opt 2016;21:86015.
- Braaf B, Vienola KV, Sheehy CK, et al. Real-time eye motion correction in phase-resolved OCT angiography with tracking SLO. Biomedical optics express 2013;4:51–65.
- Zhang Q, Huang Y, Zhang T, et al. Wide-field imaging of retinal vasculature using optical coherence tomography-based microangiography provided by motion tracking. J Biomed Opt 2015;20:066008.
- Kraus MF, Potsaid B, Mayer MA, et al. Motion correction in optical coherence tomography volumes on a per A-scan basis using orthogonal scan patterns. Biomed Opt Express 2012;3:1182–1199.
- Camino A, Jia Y, Liu G, et al. Regression-based algorithm for bulk motion subtraction in optical coherence tomography angiography. Biomedical optics express 2017;8:3053–3066.
- Zhang M, Hwang TS, Campbell JP, et al. Projection-resolved optical coherence tomographic angiography. Biomed Opt Express 2016;7:816–828.
- Gao SS, Jia Y, Liu L, et al. Compensation for Reflectance Variation in Vessel Density Quantification by Optical Coherence Tomography Angiography. Invest Ophthalmol Vis Sci 2016;57:4485–4492.
- Jia Y, Morrison JC, Tokayer J, et al. Quantitative OCT angiography of optic nerve head blood flow. Biomed Opt Express 2012;3:3127–137.
- Jia Y, Bailey ST, Hwang TS, et al. Quantitative optical coherence tomography angiography of vascular abnormalities in the living human eye. Proc Natl Acad Sci USA 2015;112:E2395–2402.
- Gao SS, Liu L, Bailey ST, et al. Quantification of choroidal neovascularization vessel length using optical coherence tomography angiography. J Biomed Opt 2016;21:076010.
- Hwang TS, Gao SS, Liu L, et al. Automated Quantification of Capillary Nonperfusion Using Optical Coherence Tomography Angiography in Diabetic Retinopathy. JAMA Ophthalmol 2016;134:367–73.
- Zhang M, Hwang TS, Dongye C, et al. Automated Quantification of Nonperfusion in Three Retinal Plexuses Using Projection-Resolved Optical Coherence Tomography Angiography in Diabetic RetinopathyQuantification of Retinal Ischemia in Three Plexuses. Invest Ophthalmol Vis Sci 2016;57:5101–5106.
- Hwang TS, Zhang M, Bhavsar K, et al. Visualization of 3 Distinct retinal plexuses by projection-resolved optical coherence tomography angiography in diabetic retinopathy. JAMA Ophthalmol 2016;134:1411–1419.
- Liu L, Gao SS, Bailey ST, et al. Automated choroidal neovascularization detection algorithm for optical coherence tomography angiography. Biomed Opt Express 2015;6:3564–3576.
- Jia Y, Bailey ST, Wilson DJ, et al. Quantitative optical coherence tomography angiography of choroidal neovascularization in age-related macular degeneration. Ophthalmology 2014;121:1435–1444.
- Camino A, Zhang M, Gao SS, et al. Evaluation of artifact reduction in optical coherence tomography angiography with real-time tracking and motion correction technology. Biomed Opt Express 2016;7:3905–3915.
- Hwang TS, Hagag AM, Wang J, et al. Automated quantification of nonperfusion areas in 3 vascular plexuses with optical coherence tomography angiography in eyes of patients with diabetes. JAMA Ophthalmol 2018;136:929–936.
- McClintic SM, Jia Y, Huang D, et al. Optical coherence tomographic angiography of choroidal neovascularization associated with central serous chorioretinopathy. JAMA Ophthalmol 2015;133:1212–1214.
- Liu L, Jia Y, Takusagawa HL, et al. Optical coherence tomography angiography of the peripapillary retina in glaucoma. JAMA Ophthalmol 2015;133:1045–1052.
- Jia Y, Wei E, Wang X, et al. Optical Coherence Tomography Angiography of Optic Disc Perfusion in Glaucoma. Ophthalmology 2014;121:1322–1332.
- Takusagawa HL, Liu L, Ma KN, et al. Projection-Resolved Optical Coherence Tomography Angiography of Macular Retinal Circulation in Glaucoma. Ophthalmol 2017;124:1589–1599.