ULTRASOUND
Ultrasound (US) is the name given to high frequency sound waves whose frequencies are beyond the range of human hearing. The range of frequencies of human hearings is 20 Hz to 20,000 Hz. Below 20 Hz our ears can not respond to these frequencies because frequency is too low. Certain animals like elephant can response to this frequency. Above 20,000 Hz, our ears can not responds to this frequency also because frequency is too high.
Hence ultrasound is the sound wave whose frequency is higher than 20,000 Hz. Depending upon the described application the sonographic frequencies range from 2-MHz to approximately 15.0 MHz
Nature of Ultrasound
Ultrasound waves is a form of longitudinal mechanical wave which needs medium to transmit from one place to another through molecules of the medium which are disturbed by periodic compression and rarefaction. Sound waves do not exit in vacuum and propagation in gases are very poor because in gases molecules are separated apart. The closer the molecules, the faster the sound waves moves through a medium. So, speed of sound wave in bone is very high approximately 4080 m/sec whereas speed of sound wave in air is just 330 m/sec (appr). The average speed of sound wave in soft tissue structure is taken as 1540 m/sec and speed of sound in fat is 1450 m/sec. This difference of speed in tissue and fat causes to produce an artifacts on ultrasound image known as propagation velocity artifacts.
It is the propagational velocity of sound wave in soft tissue which is used in ultrasonography to determine depth of an interface (Table 1.1).
Intensity of ultrasound beam is a measure of amount of energy flowing through a unit cross sectional area at each second. Intensity is expressed in a mixed unit of watt per centimeter square or milli watt per centimeter square. Average ultrasonic intensity in diagnostic ultrasound are in the range of 0.1 to 10 mW/cm2.
Intensity is measured in relative intensity relative intensity 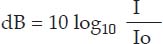
where dB is decibel
I Intensity at a point of interest
Io is original intensity or reference intensity
Ultrasound Generators
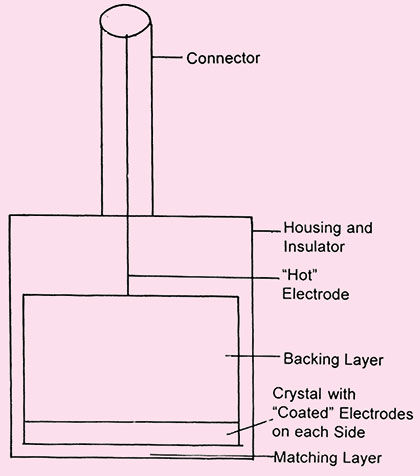
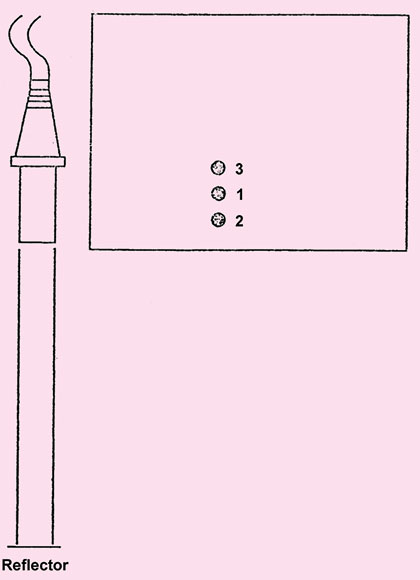
The ultrasound waves are generated by mechanical oscillation known as transducer (Fig. 1.1).
In this crystal is excited by high frequency electrical pulses which causes mechanical oscilation and that produces ultrasound waves. Hence electrical energy is converted into mechanical energy.2

As the frequency of ultrasound used in diagnostic application is about 1 MHz or 1000000 cycle/sec. The duration of emitted sound pulse is one micro second (1 μ sec), and these pulses are repeated about 1000 times per second (PRF=1KHz) (Fig. 1.2).
As these ultrasound waves passes through the medium a portion of us energy is reflected back towards the transducer and received by transducer in the form of an echo. These returning echoes in reverse converted by the same piezoelectric crystal (conventional B-mode ultrasonography) which converts echos into electric pulses that are used to generate sonographic image. Therefore transducers are both transmitter (converts electrical energy into ultrasound waves) and receiver (converts reflected portion of ultrasound waves into electrical signals) of ultrasound.
INTERACTION OF ULTRASOUND WITH MATTER
As incident ultrasound wave directed into the patient body, traverses through different soft tissue interfaces, its intensity decreases. This decrease in the intensity of incident ultrasound wave is known as attenuation.
Hence attenuation is the progessive weakening of ultrasound waves as it traverses through the medium. The reduction in the intensity of ultrasound wave is caused by five factors
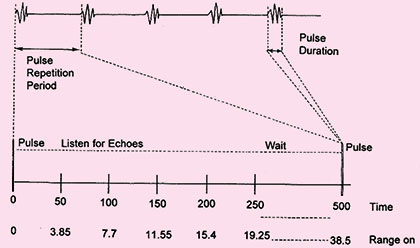
Fig. 1.2: The pulse-echo timing of data acquisition depicts the initial pulse occurring in a very short span (the pulse duration) and the remained of the time listening for echoes before the next pulse (the pulse repetition period)
- Absorption of ultrasound wave
- Reflection
- Scattering
- Refraction
- Depth
Absorption
Absorption is the process where ultrasound energy is dissipated in the medium in the form of heat energy. This is the only process where sound energy is converted into heat. All other mode of interaction (reflection, refraction and scattering) reduces intensity of ultrasound energy by redirecting beam into other directions.
The absorption of ultrasound is related to frequency of transducer, viscosity of the medium and relaxation time of the medium. Higher frequency provides better resolution and details but higher the frequency of transducer, more will the absorption. Similarly higher the viscosity of the medium and higher the relaxation time of the medium, more will be the absorption. Thus, to reach higher depth into tissue, lower frequencies should be used so waves are less likely to be diverted.
Reflection
Reflection is the return of incident ultrasound energy as an echo directly back to the transducer when 3interacting with boundary at normal incidence. Reflection occurs at the interface between two dissimilar materials (Figs 1.3A and B).
The percentage of beam reflected at tissue interfaces depends on
- Beam angle of incidence
- Tissue acoustic inpedance
The reflection of incident ultrasound pulses by the structure within patients body is the important things that create ultrasound image.
Tissue acoustic impedance The strength of returning echo depends upon on the difference in acoustic impedance between various tissues of body. Acoustic impedance related to density and elastic properties of the medium. It is represented by Z.
Z = e.v
where ‘e’ is density of the material
‘v’ is velocity of sound waves in that medium
Hence Z is a measure of resistance to sound wave passing through the medium.
If the difference in acoustic impedance increases, the intensity of echo also increases and that of transmitted sound decreases proportionally.
Angle of incidence The angle of incidence is equal to angle of reflection. These angles are defined relative to a line drawn perpendicular to the surface of interface.
Amount of reflection is determined by angle of incidence. Higher the angle of incidence, less the amount of reflected sound wave.
Tissue boundaries Depending upon the amount of reflection tissues are characterized as
- Specular reflector
- Diffuse reflector
Specular reflector Specular reflectors are those which reflects the ultrasound energy very efficiently as mirror reflect light.
The specular reflectors are smooth and continuous and their boundaries are large in comparison with the incident ultrasound wave length, e.g. the walls of vessels or tissue membrane, fetal skull, diaphragm, etc. Depending on angle at which ultrasound meets the refelector, it can reflect all or part of the beam.
For specular reflector, transducer must be positioned so that generated sound beam strikes the interface perpendicularly. This is known as perpendicular incidence (Fig. 1.4).
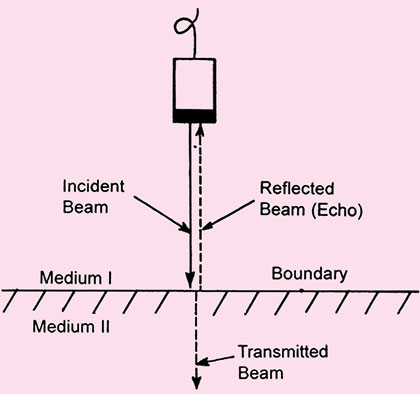
Fig. 1.3A: Specular echo. The figure represents what happens when an ultrasound beam interacts with an acoustic boundary (i.e. where medium I and medium II have different acoustic impedances). Note that under these circumstances, the beam strikes the boundary at a 90-degree angle. This results in an undeviated transmitted beam and a reflected beam, which is called a specular echo
If this beam is not perpendicular to the surface of interface this is known as oblique incidence. So even if there is specular reflector reflecting the ultrasound wave very efficiently but reflected portion of ultrasound wave will be going in the some direction and therefore will not be received by the transducer because same transducer is used both to transmit and to receive ultrasound and almost no reflective wave will be detected by transducer if ultrasound beam strikes the patient surface at angle more than 3° from perpendicular (Fig. 1.5).

Fig. 1.4: Large flat surface act as mirror-like (specular) reflectors, sending large amounts of sound back to the transducer
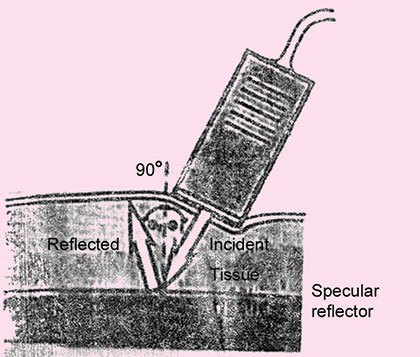
Fig. 1.5: Sound reflected from interface between tissue 1 and tissue 2 will not be detected because the transducer is too far from perpendicular
Diffuse Reflector or Scattering
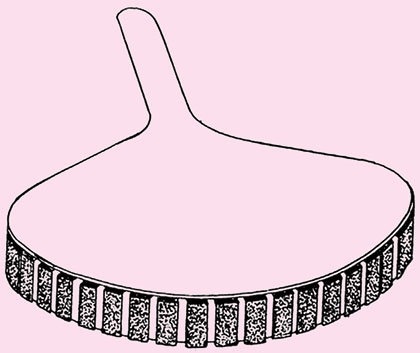
Another composite of attenuation is scattering. This type of scattering is also known as nonspecular or diffuse reflector and responsible for providing the internal texture of organ in image, e.g. lung and kidney parenchyma, red blood cells.
The scattering occur because these tissues (Fig. 1.6) represent a bumpy or rough surface and their sizes are smaller than the wave length of sound waves. The bumpy interface provides a multiple or non-perpendicular surface from which reflection occurs in all the directions causing a loss of intensity.
These surfaces are not very angle dependent as compared to the cases of specular reflector where if the beam is not perpendicular, to the surface of interface their echoes will not be recorded by the transducer. Where as in case of diffuse reflector, since sound wave is scattered in all the direction so some portion of echoes will also be recorded by the transducer. Effect of oblique, perpendicular incidence and diffuse reflection are represented in the Figures 1.7A and B.

Figs 1.7A and B: Specular and diffuse reflectors. Specular reflector. (A): The diaphragm is a large and relatively smooth surface that reflects sound like a mirror reflects light. Thus, sound striking the diaphragm at nearly a 90° angle is reflected directly back to the transducer, resulting in a strong echo. Sound striking the diaphragm obliquely is reflected away from the transducer, and an echo is not displayed (arrow). Diffuse reflector (B): In contrast to the diaphragm, the liver parenchyma consists of acoustic interfaces that are small in comparison to the wavelength of sound used for imaging. These interfaces scatter sound in all directions, and only a portion of the energy returns to the transducer to produce the image
Refraction
Refraction occurs when sound waves meets a tissue interface boundary at an angle other than 90°. Refraction is the change in the direction of transmitted ultrasound energy. This process does not generally present any difficulties in diagnostic ultrasound because velocity of sound in soft tissue is relatively constant however, bending of beam causes artifacts in the image (Fig. 1.8).
Depth: Higher the Depth, More will be Attenuation
Attenuation Attenuation as described earlier reduces the intensity of ultrasound waves due to reflection, refraction, scattering, frequency of transducer and absorption. Attenuation in soft tissue is taken as IdB/cm/MHz (Table 1.2).
|

Fig. 1.8: Snell's law. This figure represents what happens when an ultrasound beam strikes a boundary obliquely. Medium I and medium II have different acoustic impedances. The velocity of sound (Vs) in medium I and II are Vsi and Vsii respectively. Note that the angle of incidence (θi) equals the angle of reflection (θr). Also note that since Vsi is greater than Vsii, the angle of the transmitted beam (θi), or angle of refraction, is less than the angle of incidence (θr)
Water is a very good conductor of ultrasound. Water within the body such as cyst and urine filled bladder, form ultrasonic window through which underlying tissues can be easily imaged. Lungs has much higher attenuation rate than either air or soft tissue.
This is because the small pocket of air in alveoli are very efficient in scattering ultrasound energy. Because of this, normal lung structure is extremely difficult to penetrate with sound waves.
Bone shields some part of the body against easy access by ultrasound. Similarly bowel containing air conduct sound so poorly that they can not be imaged with ultrasound.
A neighbouring soft tissue or fluid filled organ must be used as a window to image a structure that is obscured by air (Fig. 1.9).
Gel or mineral oil must be placed between the transducer and the patient otherwise sound will not be transmitted across the air filled gap.
Effect of Tissue Acoustic Impedance
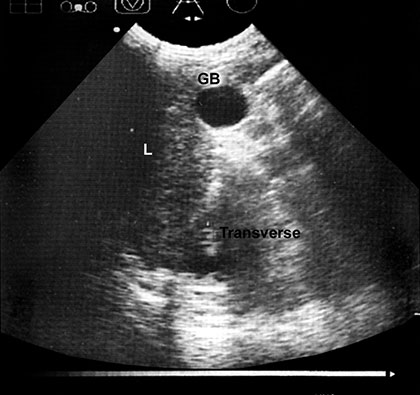
Structure of differing acoustic impedance (such as gall-bladder and liver) are much easier to distinguish from one another than structure of similar acoustic texture (e.g. liver and kidney) (Fig. 1.10).
If acoustic densities are vastly different, sound beam is completely reflected and total acoustic shadowing occurs.
Acoustic shadowing is observed behind bone (ribs), stones in kidney or the gallbladder and air (intestinal gas).
Echoes are not detected if no difference in acoustic densities are encountered. Homogenous fluid (urine and cyst content, but also ascites and pleural effusion) are seen as echo free (black) structure, e.g. gallbladder and hepatic vessels (Fig. 1.11).

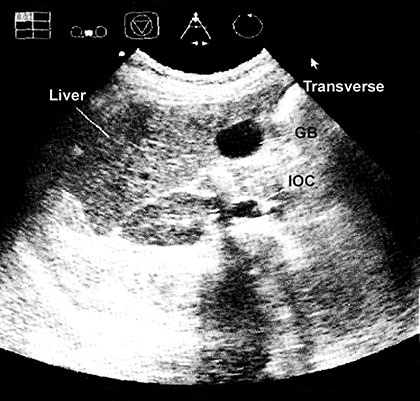
Fig. 1.10: Transverse section of liver, gallbladder and right kidney are shown in the subcostal view

Fig. 1.11: Hepatic vein. Draining into the IVC seen in this transverse section taken from the epigastrium with superior angulation
Transducer Focusing
Ultrasound waves can be focused either by lenses and mirrors or electronically in composite transducers. For best results it is necessary for any transducer to focus at the depth in the body that is most important to the 7particular clinical problems. For general purpose scanner this is usually done by using different transducers for different purposes and adjusting the focal zone on the depth as necessary.
Variable focus: Many transducers have a fixed focus. However composite transducers such as linear, convex array and annular sector transducers have electronically variable focal length which can be adjusted to the required depth. However, only annular array sector transducers have an adjustable electronic focus in all the planes.
Well adjusted focusing provides a narrow acoustic beam and a thinner image section, this gives better resolution or details and clearer picture with more information.
Instrumentation
Ultrasound images are created by using pulse echo mode format of ultrasound production and detection.
There are three basic requirements, generation of ultrasound beam, reception and amplification of returning echo and finally processing of signal into B mode display.
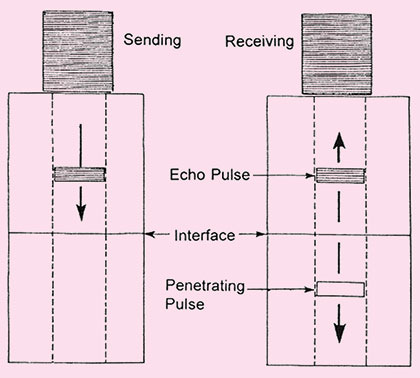
In pulse echo mode of transducer operation, a brief pulse of ultrasound is created on transducer crystal element. The ultrasound pulse that is generated by the transducer is typically 2 to 3 cycle long. These echo pulses are transmitted into the patient body. As ultrasound waves strikes various interfaces in the body as discussed earlier, some of ultrasound energy is transmitted through the interface and some is reflected in accordance with the reflective formula.
This reflective echo returns towards the transducers. These pressure wave strikes the crystal and induce a radiofrequency signal via the piezoelectric crystal (Fig. 1.3B).
Since same crystal transmit and receive ultrasound waves. So piezoelectric crystal acts a transmitter for a very brief period of time, transmitting brief pulses of ultrasound beam and rest of the crystal acts as receiver. Approximately 99 percent of the time crystal acts as a receiver and only about 1 percent of the time it acts as a transmitter of ultrasound waves.
Since intensity of echo is very weak so received radiofrequency signal is amplified. This process is known as amplification. The echoes that return from deeper structures are not as strong as those that come from tissues nearer the surface, so they must, therefore be amplified and in the ultrasound unit this is done by time gain compensation (TGC).
In all ultrasound units, it is possible to vary the degree of amplification to compensate for ultrasound attenuation in any part of body and improve the quality of final image.
Different Modes of Display
The various modes show the returning echoes in different ways:
- A mode: A mode (amplitude mode) is the most basic form of diagnostic ultrasound, here a single beam of ultrasound is analyzed, hence in this mode the ehoes are shown as peaks and the distance between the various structures and transducer can be measured (Fig. 1.12) and is displayed on time axis. Time and distance are interchangeable because an echo is assumed to travel at a constant speed in the body tissue (1540 m/sec), time it takes for the echo to return to the transducer can be converted to the distance. This mode is now almost obsolete (Fig. 1.12).
- B mode: A mode signals can be converted to dots that vary in gray scale, depending on the strength of the signal. This type of image have all the tissue traversed by ultrasound scan, the strength of signal is diplayed as brightness of dot if signal is weak dot is dark if the intensity is higher dot is brighter (Fig. 1.13).
Hence the images are 2D and are known as B mode images.
- M mode: If the series of B mode are displayed on a moving time base, the motion of mobile structure can be observed. This process forms the basis of echocardiography (Fig. 1.14).
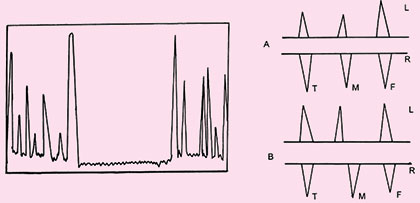

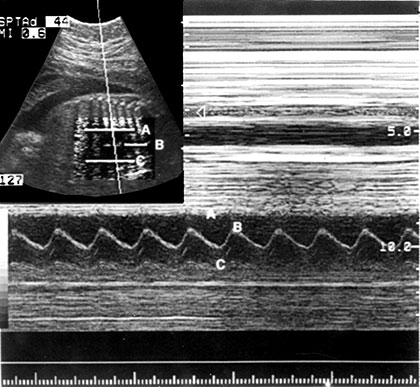
Fig. 1.14: M-mode of display changes of echo amplitude and position with time. Display of changes in echo position is useful evaluation of rapidly moving structures such as cardiac valves and chamber walls. Here the three major moving structures in an M-mode image of fetal heart corresponds to the near ventricular wall (A) interventricular septum, (B) the far ventricular wall (C) the base line is a time scale and permits calculation of heart rate and M-mode data
Real Time
This mode of displays motion by showing images of the part of body under the transducer as it is being scanned. The images change with each movement of transducer or if any part of the body is moving for example a moving fetus or pulsating artery. The movement is shown on the monitor in real time, as it occurs. In most of real time image it is possible to freeze the displayed image, holding it stationary so that it can be studied and measured as and when necessary.
TRANSDUCERS
Scanning Probes
The most important classification of real time imaging system is based on the method by which ultrasound beam is swept through the regions of interest. There are two major classes of scanner for producing real time ultrasound images.
They are known as (Figs 1.15.A and B)
- Mechanical scanner
- Electronic real time scanner
Selection of appropriate transducer of the many types of transducers only depend on the application. Three most important transducers will be discussed here.
Linear Array
Transducer scan from this type of transducer are rectangular. The width of image and number of scan lines are constant at all depth.
An advantage of the linear array transducer is that it has good near field resolution. They are primarily used with high frequency (5–7 MHz) for evaluating soft tissues like scanning the breast, used in obstetrics and for thyroid gland (Fig. 1.16).
The disadvantage of these transducers is their large contact surface, leading to artifacts when applied to a curved body contour due to air gaps between the skin and transducer. Further more acoustic shadowing as caused by ribs can deteriorate the image. In general linear array transducer is not suitable for visualizing organs in the thyroid or upper abdomen.
A Sector Array
These types of transducers produce sector like image that is narrow near the transducer and an increase in width with deeper penetration. This diverging propagation of sound can be achieved by moving the piezo-electric elements mechanically.
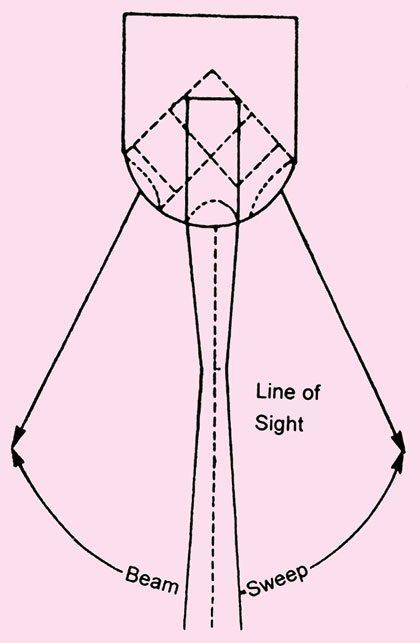

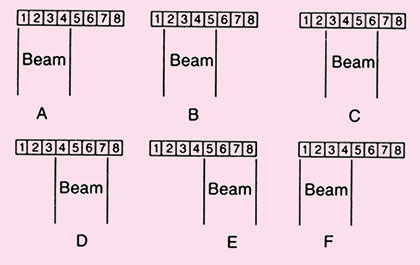
Fig. 1.16: A linear sequenced array (side view). A voltage pulse is applied simultaneously to all elements in a small group: first to elements 1 through 4 (for example) as a group (A), then to elements 2 through 5 (B), and so on across the transducer assembly (C through E). The process is then repeated (F)
This is less expensive solution but has inherent risk of wear and tear problem.
These are used as phased array transducer in electronic array transducer because primarily it is useful in cardiology with frequencies of 2–3 MHz. These transducers because of small size can be used wherever there is only a small space available for scanning like interference of ribs can be avoided by applying the transducer to intercostal spaces and by taking advantage of the beam divergency to 60 to 90° sector with increasing depth.
The disadvantage of these types of transducers are poor near field resolution, a decreasing number of scan lines at depth.
Curved or Convex Array Transducer
Curved scanners are predominatly used in abdominal sonography with frequencies from 2.5 MHz (obese patients) to 5 MHz (thin patients) with the mean value around 3.5–3.75 MHz (Fig. 1.17).
This produces a scan somewhere between those of linear and sector scanners and is therefore used for all parts of body except for specialized echo cardiography.
Operating Sonographic Equipment (Knobology)
The basic knowledge of knobology is inter changeable between different types of systems.
The critical knobs are those concerned with gain (power output), time gain compensation circuitry, left and right movement, the keep for changing the programme or transducer and freez button.
The over all amplification of the received echoes is controlled by gain knob.
Time Gain Compensation (TGC)
For selective enhancement of echoes received from different depths the amplification can also be selectively adjusted with slide pots to compensate for depth related losses in signal.
These knobes attempt to compensate for the acoustic loss that occurs by absorption, scatter, and reflection and the show structures of same acoustic strength as echoes of the same size irrespective of their depth from transducer.
Slope
Echoes: Echoes from distant tissues are smaller than those from near structure due to reflection and scattering as described earlier. The echoes from the structures near the transducers are therefore artificially reduced by the use of “slope”. Ideally, echoes from distant structures of the same acoustic strength as those from near structure of the same acoustic strength should be represented in the same fashion. Experienced sonographer can set the slope so that this is more or less achieved (Fig. 1.18).
Near Gain
Near gain controls the strengths of the echoes in the near field. In most systems the entire slope will be moved up or down as this knob is altered.

Far Gain
This controls affects only the echoes beyond the slope endpoints and is responsible for the strength of distant echoes in the image.
Artifacts
An artifact is an additional, missing or distorted image which does not represent to the real image of part being examined. It occurs due to physical properties of sound which can mimic pathological findings. Recognition of such artifacts is important because they can be misleading and even be mistaken for some important findings that may affect the diagnosis.
In some cases they can give some clues to the diagnosis: Artifacts are produced due to propogation of ultrasound beam and attenuation properties. The following assumptions are made
- Sound travels with an average speed of 1540 m/sec
- Tissue compensation is usually provided at a rate of IdB/cm/MHz
- Sound travels in the straight line and echoes occur only from the central axis of beam.
Accordingly artifacts can be classified as propagation group and attenuation group. The artifacts are:
- Section thickness artifacts
- Speckle
- Reverberation artifacts
- Refraction
- Multipath
- Side lobe grating lobe
- Comet tail artifacts
- Ring down
- Speed error from the attenuation group
- Acoustic shadowing
- Acoustic enhancement
- Edge shadowing.
Section Thickness Artifacts
Section thickness artifacts are caused when the boundary between the wall of a cyst, gallbladder or urinary bladder and the structure containing fluids is not perpendicular to the interogating ultrasound beam. These causes appearance of false debris in echo free areas and presenting as unechoic objects as echogenic. This is because an interogating beam has finite thickness on its scans through the patient. Echoes are received that orginates not only from the centre of the beam but also from off centre. These are collapsed into, thin, two dimensional image, that is composed of an echo that have come from a not a very thin tissue volume scanned by the beam.
Hence echoes within the returning beam include from liquid as well as solid structure and averaged by the process or consequently the boundaries between solid tissues and fluid is seen as a low echogenic and indistinct structure. It can mimic sludge or layered material (concrements, blood clots) in the urinary bladder (Figs 1.19 and 1.20).
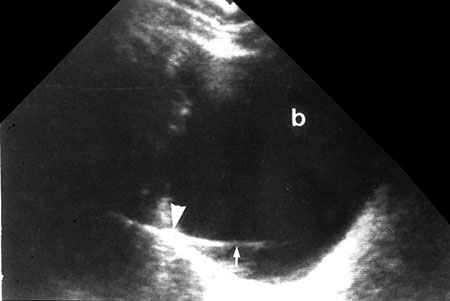
Fig. 1.19: Beam width artifact: The strong echoes from a pocket of gas in a pelvic gut loop (arrowhead) smear across the bladder (arrow)
Speckle
Apparent image resolution can be deceiving. This is sometime not directly related by scattering properties of tissue (texture), but is a result of the interference effect of the scattered sound from the description of scattering in the tissue. This phenomenon is known as acoustic speckle.
Reverberation
Reverberation occurs between transducer and a strong reflector or it can occur between two reflecting surfaces lying in the direction of beam. Here the reflector may be sufficiently strong to be detected by the instrument and to cause confusion on the display. The process by which they are produced is explained in Figure 1.21A. This result in the display of reflector that are not real.
Therefore not all echoes that originates at an acoustic interface return to the transducers without further reflection. If strongly reflecting boundaries are present sound wave can reflects back and forth before they eventually return to the transducer. This delay in registering the echo leads to reverberation. These reverberation echoes are projected as several parallel line placed beneath the real reflector at separate interval equal to separation between the transducer and real structure. And each subsequent echo is weaker than prior one, e.g. from intestinal gas to liver or ribs, urinary bladder or gallbladder. Reverberation can obscure tissue that lie behind the gas (Fig. 1.21B).
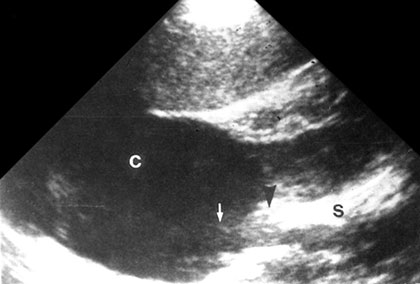
Fig. 1.20: Beam width artifact: A weaker beam spread artifact misplaces echoes from the more reflective sinus tissues (arrow-head) into in renal cyst (arrow)
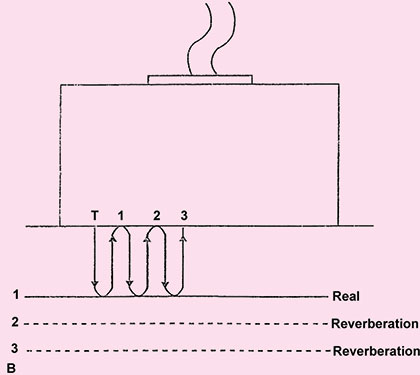
Fig. 1.21A: Reverberation (arrowheads) resulting from multiple reflection through a water path between a linear-array transducer (straight arrow) and the surface of an apple (curved arrow)
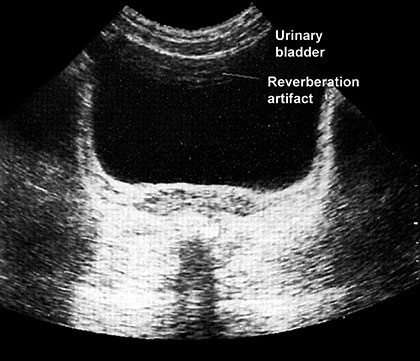
Fig. 1.21B: Echoes seen in the anterior portion of the urinary bladder due to reverberation artifacts
Multipath
The term multipath describes a situation where the path to and from a reflector are difficult. Multipath results in improper positioning of the reflector image. Because multiple reflection are involved. These echoes are quite weak and probably “muddy” the image some what (Figs 1.22A and B).
Mirror Image
Mirror image artifacts presents structure that lie one side of a strong reflector and the other side an image as well.

Fig. 1.22A: Multipath artifact: Echoes reflected from the diaphragm—Result in artificial image of the liver appearing above the diaphragm (simulated image)
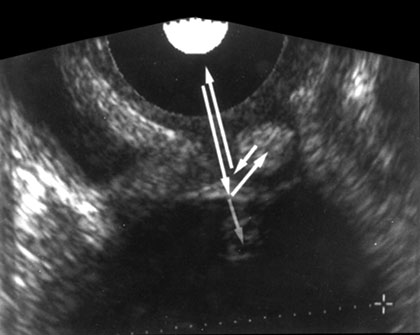
Fig. 1.22B: Multipath artifact: Echoes reflected from wall of an ovarian cyst. It gives misdiagnosis as the artifact suggests a mural nodule in what is actually a simple ovarian cyst
This commonly occurs around the diaphragm and pleura because of total reflection from an air-filled lung. Sometime the mirrored structure is not in the unmirrored scan plane (Fig. 1.23).
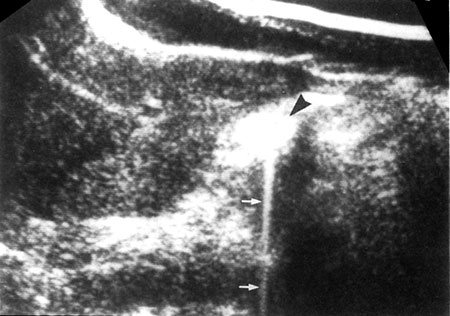
Side Lobes
Side lobes are produced because that propagate from a single element in direction different from the primary beam. Grating lobes are extra beams emitted from an array transducer side and grating lobes are weaker than primary beam and does not normally produce echoes that are imaged particularly if they fall on a normally echogenic region of the scan.
However, if these lobes encounters a strong reflector (bone or gas), their echoes may well be imaged particularly if they fall within an unechoic region. If so they appear in incorrect locations (Figs 1.24A and B).
Comet Tail
It is a series of closely spaced discreate echoes appears to be similar as with reverberation (Figs 1.25A and B).
Ring Down
This artifact appears to be similar with comet tail artifact but is fundamentally different from comet tail artifact.


Figs 1.24A and B: Side lobe artifact—Transverse image of gall-bladder reveals a bright internal echo. (A) Suggest a band of septum within gallbladder. This is side lobe artifact related to presence of a strong out of plane reflector, (B) Medial to the gallbladder. The low level echoes in the dependant portion of the gallbladder, (C) Are also artificial. Side lobe and slice thickness artifacts are of clinical importance as they may create impression of debris in fluid-filled structures
Here discrete echoes cannot be identified because a continuous emission of sound from origin may be occurring. The mechanism for ring down artifacts is not well understood but they may be caused by resonance phenomenon associated with gas bubbles.
Propagational Speed
Error occurs when speed of sound assumed as 1540 m/sec is different. If speed is greater than this the calculated distance is small and display will show reflector close to the transducer.

If the speed is less that 1540 m/sec e.g. for fat, the reflector will be displayed down than actually it is (Figs 1.26A and B).
Refraction
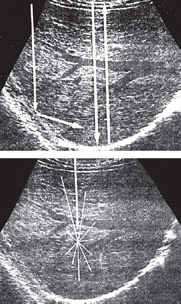
Refraction can cause artifacts to be positioned improperly. This is likely to occur, when the transducer is placed on the abdominal midline (Fig. 1.27). Producing double image of single object.
Significant subcutaneous fat and muscle can scatter ultrasound, making the images of deeper structures less distinct. Sometimes the muscles cause a double ultrasonic image giving a false impression of separation giving incorrect diagnosis (twins) may also occur (Fig. 1.27).
Acoustic Shadowing
An acoustic shadowing appears as a zone of reduced echogenicity (hypoechoic or anechoic black) and formed behind a strongly reflecting structure such as calcium containing bone.

Figs 1.26A and B: When sound passes through a lesion containing fat, echo pattern is delayed because fat has propagation velocity of 1450 m 1/sec which is less than the liver. Therefore fine image shows a misregistration artifact. In which the diaphragm and other structures deep to fatty lesion are shown in deeper position than expected (simulated images)
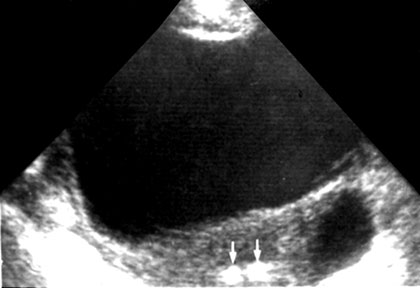
Fig. 1.27: Refractive artifacts—Refraction of the ultrasound beam by the fatty tissues in the anterior abdominal wall can produce split or double images such as this apparent double IUCD in the uterus (arrows)
Thus the visualization of soft tissue structures in the upper abdomen is obscured by overlying ribs, and those of lower pelvis by pubic symphysis.
This effect can however be exploited to reveal calcific gallstones, renal stones and atherosclerotic plaques (Figs 1.28A and B).
Similar shadowing can be caused by air in the lung or intestinal tract. Evaluating structures behind air containing bowel loop is often precluded by acoustic shadowing.
Air Artifacts
Air interfere primarily with the evaluation of retroperitoneal organs (pancreas, kidney and lymph nodes) behind air containing stomach or bowel.
Edge Shadowing
This occurs principally between all round cavities that are tangentially hit by sound beam. Edge shadowing is caused by scattering and refraction and can be seen behind the gallbladder.
Acoustic Enhancement
Acoustic enhancement is formed wherever sound wave travel for some distance through homogenous fluid because of decreased attenuation in fluid are over compensated by the system. This produces increased echogenicity that is seen as a bright area behind the gallbladder or behind the urinary bladder and even behind major vessels such as aorta.
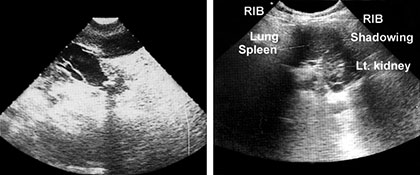
Figs 1.28A and B: (A) CBD calculus—a grossly dilated CBD (measuring 23 mm) is seen with a echogenic focus with shadowing at its distal end, (B) Shadows from overlying gases hindering visualization of posterior structures
This increased echogenicity is a physical phenomenon unrelated to the true characteristics of the underlying tissues.
The acoustic enhancement however, can be applied to distinguish renal or hepatic cysts from hypoechoic tumors (Fig. 1.29).