

PRINCIPLE OF ULTRASOUND
- Sound is a mechanical disturbance transmitted through a medium which may be gas, liquid or solid.
- Every sound has a particular frequency, its own velocity and an intensity.
- Frequency of sound is the number of times per second, sound undergoes a cycle of rise and fall. It is expressed in cycles per second, or hertz (Hz) and multiples thereof.
- 1Hz is 1 cycle per second and units of frequency are kilo Hz (1kHz = 103 Hz) and mega Hz (1MHz = 106 Hz).
- Frequency is appreciated as the pitch of sound by the listener.
- Wavelength is the distance travelled by sound in one cycle of rise and fall. The length of the wave is the distance between two consecutive peaks.
- Frequency and wavelength are interrelated. Since sound travels a fixed distance in one second, more the cycles in a second (greater the frequency), shorter is the wavelength (Fig. 1.1).
- Therefore, Velocity = Frequency × Wavelength.


Fig. 1.1: Relationship between frequency and wave-length:
A. High frequency, short wave-length
B. Low frequency, long wave-length
- Velocity of sound is expressed in meters per second or m/sec and is determined by the nature of the medium through which sound propagates.
- In soft tissue, the speed of sound is 1540 m/sec.
- Intensity of sound is nothing but its loudness or audibility expressed in decibels. Higher the intensity of sound, greater is the distance up to which it is audible.
- Sound of a frequency greater than what can be perceived by the human ear (more than 20 kHz) is called ultrasound.
- The technique of using ultrasound to examine the heart is known as echocardiography or simply ECHO.
- Ultrasound relies on the property of certain crystals to transform electrical current of varying voltage into mechanical oscillations or ultrasound waves. This is known as the piezoelectric (pressure-electric) effect (Fig. 1.2).
- When electrical current is passed through a piezoelectric crystal, the crystal vibrates.This generates ultrasound waves which are transmitted through the body by the transducer which houses several such crystals.
- Most of these ultrasound waves are scattered or absorbed by tissues while a small proportion is reflected back to the transducer, i.e. echoed. Reflected ultrasound again distorts the piezoelectric crystals and produces an electrical current.
- The reflected signal gives information about the depth and nature of the tissue studied. Most of the reflection occurs at interfaces between tissues having different echo-density and thus a different echo-reflectivity.
- The magnitude of electrical current produced by the reflected ultrasound determines the intensity and brightness on the display screen.
- On the grey-scale,
- * high reflectivity (e.g. from bone) is white
- * low reflectivity (e.g. from muscle) is grey,
- * and no reflection (e.g. from air) is black.
- The location of the image produced by the reflected ultrasound depends upon the time lag between transmission and reflection of ultrasound.
- Deeper structures are shown on the lower portion of the display screen while superficial structures are shown on the upper portion. This is because the transducer is at the apex of the triangular image on the screen (Fig. 1.3).
- When ultrasound is transmitted through a uniform medium, it maintains its original direction and get progressively scattered and absorbed.
- When ultrasound waves generated by the transducer encounter an interface between tissues of different density and thus different echo-reflectivity, some of the ultrasound waves are reflected back.


Fig. 1.3: The transducer is at the apex of the image:
A. Right ventricle in upper portion
B. Left ventricle in lower portion
- It is these reflected ultrasound waves that are collected by the transducer and analysed by the echo-machine.
- The wavelength of sound is the ratio between velocity and frequency (Wavelength = Velocity/Frequency).
- Since wavelength and frequency are inversely related, higher the frequency of ultrasound, shorter is the wavelength.
- Shorter the wavelength, higher is the image resolution and lesser is the penetration. Therefore, high frequency probes (5.0 to 7.5 MHz) provide better resolution when applied for superficial structures and in children (Table 1.1).
- Conversely, lower the frequency of ultrasound, longer is the wavelength.
- Longer the wavelength, lower is the image resolution and greater is the tissue penetration.
- Therefore, low frequency probes (2.5 to 3.5 MHz) provide better penetration when applied for deeper structures and in adults (Table 1.1).
|
PRINCIPLE OF DOPPLER
- The Doppler effect is present and used by us in everyday life, even if we don't realise it. Imagine an automobile sounding the horn and moving towards you, going past you and then away from you.
- The pitch of the horn sound is higher when it approaches you (higher frequency) than when it goes away from you (lower frequency).
- The change of frequency (Doppler shift) depends upon the speed of the automobile and the original frequency of the horn sound.
- Ultrasound reflected back from a tissue interface gives information about the depth and echo-reflectivity of the tissue being studied.
- On the other hand, Doppler utilizes ultrasound reflected back by moving red blood cells (RBCs).
- The Doppler principle is used to derive the velocity of blood flow. Flow velocity is derived from the change of frequency that occurs between transmitted (original) and reflected (observed) ultrasound.
- The shift of frequency (Doppler shift) is proportional to ratio of velocity of blood to speed of sound and to the original frequency.

Therefore, velocity of blood flow is

A further refinement of this formula is:

- The original frequency (Fo) is multiplied by 2 since Doppler shift occurs twice during forward transmission as well as during backward reflection.
- Cosine theta (Cosθ) is applied as a correction for the angle between the ultrasound beam and blood flow.
- Cosθ = 1 if beam is parallel to direction of blood flow and maximum velocity is observed. Cosθ = 0 if beam is perpendicular to direction of blood flow and zero velocity is observed.
- The angle between the beam and flow should be less than 20° to ensure accurate measurement.
- It is noteworthy that for Doppler echo, maximum velocity information is obtained with the ultrasound beam aligned parallel to the direction of blood flow being studied.
- Otherwise, the peak velocity and consequently the pressure gradient (see below) are likely to be underestimated.
- Since the original frequency value (2 Fo) is in the denominator of the velocity equation, it is important to remember that maximum velocity information is obtained using a low frequency transducer (2.5 MHz probe).
- There is a direct relationship between the peak flow velocity through a stenotic valve and the pressure gradient across it.
- Understandably, when the valve orifice is small, blood flow has to accelerate in order to eject the same stroke volume. This increase in velocity can be measured using Doppler echo.
- The pressure gradient across the valve can be calculated using the simplified Bernaulli equation:ΔP = 4 V2P: pressure gradient (in mm Hg)V: peak flow velocity (in m/sec)
- This equation is frequently used during Doppler evaluation of stenotic valves, regurgitant lesions and intracardiac shunts.
- The velocity information provided by Doppler echo complements the anatomical information provided by M-mode and 2-D ECHO.
- Analysis of the returning Doppler signal not only provides information about flow velocity but also about flow direction.
- By convention, velocities towards the transducer are displayed above the baseline (positive deflection) and velocities away from the transducer are displayed below the baseline (negative deflection) (Fig. 1.4).
- The returning Doppler signal is a spectral trace of velocity display on a time axis. The area under curve (AUC) of the spectral trace is known as the flow velocity integral (FVI) of that velocity display.
- The value of FVI is determined by peak flow velocity and ejection time. It can be calculated by the computer of most echo machines.

Fig. 1.4: Direction of blood flow and polarity of deflection:
A. Towards the transducer, positive deflection,
B. Away from transducer, negative deflection
- Careful analysis of the spectral trace of velocity also gives densitometric information. Density relates to the number of RBCs moving at a given velocity.
- When blood flow is smooth or laminar, most RBCs are travelling at the same velocity, accelerating and decelerating simultaneously.
- The spectral trace then has a thin outline with very few RBCs travelling at other velocities (Figs 1.5A and C). This is known as low variance of velocities.
- When blood flow is turbulent as across stenotic valves, there is a wide distribution of RBCs velocities and the Doppler signal appears “filled in” (Fig. 1.5B).This is known as high variance of velocities, “spectral broadening” or “increased band width”.
- It is to be borne in mind that turbulence and spectral broadening are often associated with but not synonymous with a high velocity signal.
- The intensity of the Doppler signal is represented on the grey-scale as increasing shades of grey.
- Maximum number of RBCs travelling at a particular velocity cast a dark shade on the spectral trace. Few RBCs travelling at a higher velocity cast a lighter shade.
- This is best seen on the Doppler signal from a stenotic valve. The spectral display is most dense near the baseline reflecting most RBCs moving at a low velocity just above and just below the valve (Fig. 1.6A).
- Few RBCs accelerating through the stenotic valve are at a high velocity (Fig. 1.6B).

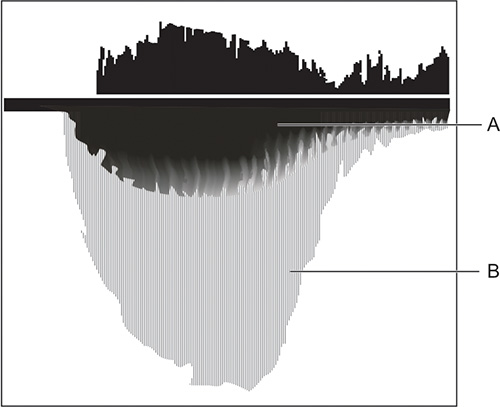
Fig. 1.6: Continuous wave Doppler signal from a stenotic aortic valve showing turbulent flow:
A. Most RBCs moving at low velocity,
B. Few RBCs moving at high velocity
- The Doppler echo modes used clinically are continuous wave (CW) Doppler and pulsed wave (PW) Doppler.
- In CW Doppler, two piezoelectric crystals are used, one transmitting continuously and the other receiving continuously without any time delay.
- It can measure high velocities but it cannot precisely localize a signal which may originate from anywhere along the length or width of the ultrasound beam.
- In PW Doppler, a single piezoelectric crystal is used to transmit ultrasound and then to receive it after a preset time delay.
- PW Doppler can precisely localize the site of origin of a velocity signal.
- To localize the velocity, a ‘sample volume’ indicated by a small box or circle, is placed over the 2-D image at the region of interest. The ‘sample volume’ is moved up and down along the path of PW beam, until a maximum velocity signal is obtained (Fig. 1.7).

Fig. 1.7: Pulsed wave Doppler signal from various levels of the left ventricle: A. LV apex, B. Mid LV, C. Sub-aortic
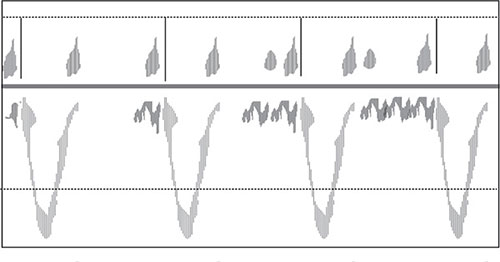
- Because of the time delay in receiving the reflected ultrasound signal, PW Doppler cannot accurately detect high velocities exceeding 2 m/sec.
- However, PW Doppler provides a spectral tracings of better quality than does CW Doppler (Fig. 1.8).
- In PW Doppler, the rate of pulse emission or pulse repetition frequency (PRF) should be greater than twice the velocity being measured. The PRF decreases as the depth of interrogation increases.
- The maximum value of Doppler frequency shift that can be accurately measured with a given PRF is called the Nyquist limit.
- If the Nyquist limit is exceeded, the phenomenon of aliasing occurs. Aliasing is an artificial reversal of velocity and distortion of the reflected signal also called “wrap around.”
- Aliasing can be overcome by one of these modifications:
- high pulse repetition frequency
- multigate acquisition technique
- reducing the depth of interrogation
- shifting the baseline of spectral display.