

Positioning of Patient
Supine position: First set of images is acquired in supine position for the children, because subcostal windows are easily available in children. Liver tissue provides good acoustic windows. Several cuts of heart can be seen with slight movement of probe. The pediatric echo examination starts with subcostal window hence patient is kept in supine posture.
Left lateral position: Optimal positioning for most echo examinations is the left lateral position. Because it brings heart nearer to thoracic cage little away from sternum, displacing the lungs and gives a better image.
Figures 1.1A to C show first frame (1.1A) of 2D image of a 4 chamber apical view. Second frame (1.1B) shows a color image of apical 4 chamber view and third frame (1C) shows a Doppler velocity across tricuspid valve in a patient with pulmonary artery hypertension.


Fig. 1.1B: Color image of apical 4 chamber view. Note the red flow in LV and RV and pointer at left lower side of image. Normal flow from LA to LV will be red color as blood flowing towards pointer is represented as red. Any regurgitation at mitral or tricuspid valve will be blue in color as blood going back from LV to LA (MR) or RV to RA (TR) will be away from pointer

Fig. 1.1C: CW Doppler of TR jet. Note that TR jet is directed away from probe, so the Doppler signal will be below the baseline
Modality
2D Echo: The various components of the heart (muscle, valves, vessels, septa, etc.) could be seen. Therefore intracardiac shunts, obstructive valvular lesions, functional abnormalities can be identified (Fig. 1.1A). This is useful to identify ventricular function in various views by eye-balling. 2D imaging is like drawing a sketch of heart in a paper. We can see only two dimensions of the heart in a given view. Hence we use multiple views to understand anatomy of the heart.
The Doppler principles: In pediatric echocardiography, we need to know direction of blood flow and velocity of stream of blood. The extra information about direction and velocity of blood flow is acquired by Doppler principles.
Color flow Doppler: The flow of blood within the heart and blood vessels could also be seen in a feature termed color Doppler. This moment of blood is coded in usually two different colors: blue and red. The blue represents the blood which is heading away from the transducer and the red represents the blood which is flowing towards the transducer.3 This enables the visualization of abnormalities of blood flow such as obstruction/regurgitation and direction of shunt flows either left to right or right to left (Fig. 1.1B). (One must know that these color code can be changed manually). Second important thing is that, these colors are displayed according to probe position. For example superior vena cava can be visualized from subcostal view and from the suprasternal view. In subcostal view, the SVC blood is flowing towards the probe so it will be seen as red. In suprasternal view, SVC blood flow is away from probe so it is seen as blue. Also color flow has to be smooth in a normal heart. An increase in Velocity is shown by a turbulent mosaic of colors. In Color flow, velocities and quantum can be guessed only which are subsequently confirmed on Doppler.
Pulse Doppler and Continuous wave Doppler: The pressure difference between one part of the heart and the other could be determined since the ultrasound waves bouncing off blood would change its sound wave length depending upon the speed with which the blood flows (blood velocity). This is known as the Doppler phenomenon. Blood travels at higher velocities when there is a greater pressure difference between two parts of the heart. For example, if there is a child with aortic stenosis, the left ventricle will squeeze harder to push the blood through the blocked aortic valve resulting in propelling of blood at a higher speed. This higher speed (velocity) of blood can then be measured by the Doppler equipment of the echocardiogram and an estimation of pressure gradient across the pulmonary valve can be calculated (Fig. 1.1C).
There are two types of Doppler called as pulse wave Doppler (PW) and continuous wave Doppler (CW). CW is used when velocities are very high like estimation of PA pressure by TR. PW is used when velocities are low or we want to know the exact point of origin of velocity like in pulmonary veins.
The application of Doppler principles in this modality is shown above and below a base line. The direction of blood flow towards probe is shown above the base line and a blood flow away from probe will be below the base line. Figure 1.1C demonstrates a TR jet Doppler. As TR jet is going away from transducer; the Doppler signal is below the baseline.
It is useful to visualize the heart as being transacted by three main axes of imaging.
Three Orthogonal Planes (Fig. 1.2)
- Long Axis—Runs from right shoulder to left hip-transects the heart from aortic root to the left ventricular apex.
- Short Axis—Runs from left mid clavicle to the right hip: Also called as basal view. We can see LA, RA, TV, RVOT, aortic valve, MPA and bifurcation of PA in single view.
- Four Chamber—The plane of probe is almost same as short axis parasternal view. It is obtained by keeping probe at the apex. And we see heart from apex to the base; perpendicular to other 2 axes.
Position of the heart: We must know that heart is positioned in little oblique position (Fig. 1.3). Its apex points towards the left and anterior chest wall. It rests mainly on left dome of diaphragm.
4This oblique orientation of heart at anteroposterior axis brings veno-atrial segment posterior and little towards right while ventricular mass is placed relatively anterior and left. Similarly, the aortic valve, pulmonary valve, ascending aorta and proximal pulmonary arteries are anteriorly placed. All right sided structures are relatively anterior to the left sided structures. What does it mean?


So if we arrange cardiac structures in anteroposterior axis, it would be like this:
1 (most posterior) | Veno atrial segment with RA and systemic vein and coronary sinus are placed little anterior to pulmonary veins and left atrium |
2 (Middle) | Tricuspid and mitral valve and ventricular mass (TV and RV relatively anterior to MV/LV) |
3 (Most anterior) | Aortic valve, Pulmonary valve However the color Doppler and CW Doppler signals will show blue flow at AV and PV (Fig. 1.4). This is because blood is flowing in to great vessels which leave by leaning back in superior mediastinum. |

Exercise: Blood flow display in color and spectral Doppler in the normal heart: (Fill-up the right answers)
Site
| Color Doppler
| Pulse Doppler
| ||
|---|---|---|---|---|
Red
| Blue
| Above the base line
| Below the base line
| |
Tricuspid valve in apical view | ||||
Mitral valve in apical view | ||||
Aortic valve apical view | ||||
Pulmonary valve in apical view | ||||
SVC in subcostal view | ||||
SVC in suprasternal view | ||||
Descending aorta in subcostal view | ||||
Descending aorta in suprasternal view | ||||
Starting the Procedure
- Adjust the height of the patient bed for your comfort. Keep the machine close so your other non-probe hand can operate controls.
- Dim the lights.
- Use adequate ultrasound jelly on the probe (Fig. 1.6).
- The jelly can be warmed before hand.
- Adjust the time-gain control (a series of sliders arranged in a row) so that the picture has uniform brightness from top to bottom.
- Use depth knob to set the minimum depth required. The main structure of interest should be in the center of the screen.

Fig. 1.6: Left lateral position of patient, probe position for apical 4C view. The pointer should be directed at 3'O clock position at apex
How to get sustained position of a patient: We sometimes use pillows behind the back in left lateral position and a roll under shoulders for suprasternal views.
Without Sedation
Neonates: They are nestled by giving a special wrap which holds the limbs but chest and upper abdomen is exposed. One can use soother to make neonates comfortable. They must be fed adequately.
Infants below the 10 months of age: They are happy and playful in and are responsive to pleasant colorful objects and musical toys if they are fed adequately.
Infants >10 months to 24 months: These babies are not very social. They do not trust easily and need sedation.
Children age-group 24-40 week: Mostly respond to friendly gestures, candies. They can be win-over with little explanation and friendly attitude.
Babies with trisomy 21: These babies are hypotonic but friendly. Sometimes they may be irritable. They are resistant to sedation. A pleasant music can make them cooperative.
Babies with cyanotic CHD are, in general, irritable and resist sedation.
Sedation
Chloral Hydrate: For sedation prior to medical procedures in infants and children, the recommended dose of chloral hydrate is 50 to 75 mg/kg given orally. The strength is 100 mg/1 mL. One can start with ½ mL/kg and a second dose of ¼ mL/kg can be given ½ hour interval. Trichloroethanol, (Pedicloryl) the pharmacologically active metabolite of chloral hydrate, results in less gastric irritation and has a less unpleasant taste than chloral hydrate, and it is, therefore, more acceptable for oral administration in children. Doses are similar to Chloral hydrate.
Patient need not be kept nil orally. However vomiting, excessive sedation, irritable behavior may occur. Midazolam: intranasal midazolam as drops or spray has been used in several centers. It has rapid onset of action (6–10 min) and short duration of action (20–30 min). The dose is 0.2 mg/kg and additional dose can be supplemented.
Echocardiography Views
There are four main echocardiographic windows: (1) parasternal, (2) apical, (3) subcostal, and (4) suprasternal notch. The parasternal and apical windows are obtained with the patient in a left lateral decubitus position (especially in older children with thick chest walls) and Subcostal images are obtained with the supine position. Suprasternal notch images are obtained with a roll under the shoulders so that the neck is hyper extended. Additional right lateral position is used mainly for aortic valve stenosis (Fig. 1.7).

Selection of Probe
The use of appropriate probe is important for quality of an echo image. Selection of appropriate probe will reduce chances error because of better visualization. The principle to be remembered is –higher the probe frequency, better the resolution of image but at a cost of less depth. This means a higher frequency probe (9–12 Hz) is good for small neonates whereas for adults lower frequency probe (3–5 Hz) will be needed to penetrate the tissues. Similarly for a subcostal view lower frequency probe is usually good (as more depth is needed) and for PLAX and PSAX views (where less depth is needed), higher frequency probe will be a better option.
Adjustments for Echo Image
Three important adjustments have to be done are: 1—Optimizing scale; 2—Optimizing gain; 3—Baseline.
Optimizing scale in color Doppler means reducing the color scale in low velocity lesions like a PFO shunt which otherwise will be missed if we keep scale in high range. Similarly color scale in high velocity lesions as MR will be high otherwise lesion will be very difficult to grade in severity. Optimizing scale in Doppler means getting a good envelope depending on velocity of jet lesion, so adjustment has to be according to lesion. In PW and CW, adjust baseline and scale so that the entire waveform is seen.
Optimizing gain in 2D—Adjust the overall gain knob till the picture is neither too dark nor too bright.
Measurement
All machines have function key for calliper which can be operated either by a trackball or a touch pad, which allow measurements of distance, time and area. These measurements form the basis of the hemodynamics calculations such as velocities, gradients, area and size. More sophisticated machines have automated measurement devices and calculation options.
Transducer position: At left sternal edge; 2nd to 4th intercostal space. An image is created which has right ventricle at top (most anterior structure) and left ventricle at bottom (most posterior).
Marker dot direction: Points towards right shoulder. The parasternal long axis view is commonly the first view obtained in an echo examination (as it highly convenient for patients) and is useful for assessing contractility visually, calculating ejection fraction in M-mode, detecting regional wall motion abnormalities and measuring LV outflow tract diameter for cardiac output studies. Remember the first view in most congenital heart lesions is subcostal as we start from the situs abnormalities there.


Fig. 1.10: PLAX view demonstrating normally visualized structures (AO = Aorta; MV = Mitral valve; and DA = Descending aorta)

Tips for Image Optimization (Fig. 1.12)


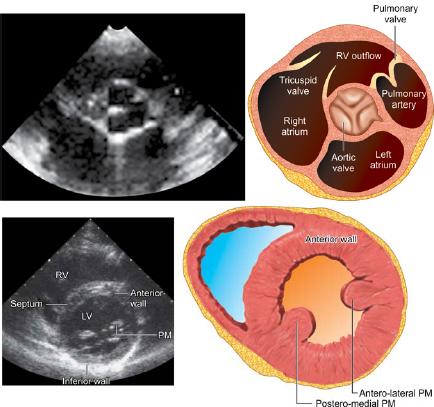
Fig. 1.14: PSAX views; Changing the angle of the ultrasound probe results in being able to view short axis images from the aortic root down to the apex
Transducer position: Left sternal edge; 2nd to 4th intercostal spaces.
Marker dot direction: Points towards left shoulder (90 degrees clockwise from PLAX view).
This view concentrates on base of heart from right to left.
By tilting the transducer on an axis between the left hip and the right shoulder, short-axis views are obtained at various levels, from the aorta to the LV apex. This angulation of the transducer from the base to the apex of the heart 13for short axis views is known as “bread loafing”. Short axis sections are viewed at Aortic root level, mitral valve level and papillary muscle level.
This view helps in getting the morphological site of VSD, presence or absence of aneurysm of sinus of Valsalva, RVOT, pulmonary valve and pulmonary arteries. In adults this view gives some evidence for presence of atrial septal defect and clot in LA appendage.
The parasternal short axis view at the level of the aortic valve is important to see great vessel relation-ship (important to diagnose TGA), anatomy of tricuspid valve, aortic valve, pulmonary valve, main pulmonary artery and origin of branch pulmonary artery (useful to diagnose PDA), the presence or absence of ventricular septal defect. It is also used to rule out vegetation, and other abnormalities of aortic valve structure.

Fig. 1.15: PSAX view showing normal tricuspid aortic valve, and demonstrating interatrial septum, tricuspid valve and other structures. (RVOT-Right ventricular outflow tract, MPA-Main pulmonary artery). Please note tilting probe in anterior direction from here will open the branch Pulmonary arteries and show PDA if present. Also note here the anterior position of pulmonary valve in relation to aorta

Fig. 1.16: PSAX view in a patient with D-Transposition of great arteries. Note the anterior position of aortic valve in relation to pulmonary valve.
14The parasternal short axis view at the level of the mitral valve is used to measure mitral valve area and to decide the cause of mitral regurgitation (like cleft in mitral valve).
The parasternal short axis view at the papillary muscle level is useful for assessing the LV end diastolic area (an index of volume status), visual assessment of contractility, to detect regional wall motion abnormalities and also right ventricular enlargement.
Imaging of patent ductus arteriosus: In sick neonates, one must be able to recognize PDA and pattern of color flow. Usually echo examination for detection of PDA must be done day 3 onwards. A PDA size more than 1.5 mm can produce hemodynamic consequences in newborns. PDA is mostly shunting left to right and appears as a red jet in such cases. The color flow of PDA in sick neonates can be bidirectional or right to left and in such cases may be difficult to detect.
Color Flow in PDA
Subsystemic pressure PDA: Red color in PSAX view
Hypertensive PDA: Either red or blue at different parts of cardiac cycle (bidirectional) or absolutely right to left in some cases (all blue color).
To see a PDA, one must try to make a good parasternal short axis view and see MPA, RPA and LPA. Normally when PDA is absent, you expect smooth blue there. If you see turbulence or mosaic then you have to think of:
- Pulmonary stenosis
- Branch PA stenosis
- PDA.
If you keep CW Doppler, you may get continuous flow above the base line.
To get a direct visualization of duct you have to make a PDA view (Fig. 1.17). For this you rotate your probe counter-clockwise from the standard PSAX view and go little up nearer to clavicle (Figs 1.18 and 1.19).


Fig. 1.18: PSAX view with anterior tilted probe showing branch pulmonary arteries and PDA (note the measurement of PDA being 0.404 cm)

Fig. 1.19: Color image of the above mentioned patient showing a red jet of PDA, this red flow means that PDA is shunting left to right and PA pressures are subsystemic)

Fig. 1.20: CW signal across above mentioned PDA demonstrating continuous flow in PDA with a peak gradient of 119 mm Hg. PA pressure can be derived from this gradient (apply formula Systolic BP –PDA gradient (119 mm Hg) and supposing a BP of 140 mm Hg here, peak PA pressure will be 140–119 = 21 mm Hg)
Apical 4 and 5 Chamber View
The apical views are obtained by placing the probe at the point of maximal impulse.
Transducer position: Apex of the heart
Marker dot direction: Points towards left shoulder


Fig. 1.23: Apical 4C view (please note that there are two groups here; where some people do 4C view with ventricles upwards and some (mostly congenital cases) do 4C view with ventricles downward view. This is just a matter of practice, in what way we do a 4C view)

Fig. 1.24: Apical 4C view showing well formed 4 chambers of heart and tricuspid/mitral valve movements should be noted in moving images. This is a good view to diagnose inlet VSD and muscular VSD. Please note that anterior muscular and apical muscular VSD may be missed in this view

Fig. 1.25: Probe position for apical 4C view, with pointer at 3'O clock position at the apical impulse
The apical 4 chamber view is used to detect and quantify mitral and tricuspid regurgitation and stenosis by using color flow imaging and Doppler. It is also used to detect right ventricular enlargement, visually assess RV and LV contractility, calculate ejection fraction using the 2D method, assess mitral and tricuspid inflow patterns and measure pulmonary vein inflow for diastolic function.
Apical 5 Chamber View (A5C)
Transducer position and marker dot direction are same as the A4C view. The A5C view is obtained from the A4C by slight anterior angulation of the transducer towards the chest wall. The 5th chamber added is the LVOT (Figs 1.26A to C). (This view also known as long axial view)


Fig. 1.26B: Apical 5 chamber view in 2D showing opening of left ventricular outflow tract (LVOT) by tilting probe anteriorly from a apical 4C view

Fig. 1.26C: Apical 5 chamber view (color)—the LVOT, aortic valve and root are visualized. Note the normal color will be blue in aorta as blood is flowing away from probe. Any turbulence/mosaic pattern will be suggestive of aortic stenosis and any red color here will be suggestive of aortic regurgitation
The apical 5 chambered view is used to measure LV outflow tract velocities to measure cardiac output. It is also useful to detect and quantify aortic regurgitation and stenosis using color flow imaging and Doppler.
Subcostal View
The patient should ideally be placed in a supine position for a subcostal view examination (Fig. 1.27). The abdomen has to be relaxed to allow indentation of the probe into the epigastrium.
Transducer position: Under the xiphisternum.
Marker dot direction: Coronal plane points towards left, sagittal plane towards chin of patient.

Fig. 27: Probe position—Subcostal view, sagittal view, pointer 12'O clock position and then rotate right and left wards.

Fig. 1.28: Evaluation of Situs: Subcostal view in coronal section (probe pointer-towards left; direction towards spine)
The inferior vena cava (IVC), descending aorta, interatrial septum and pericardial effusions are best seen in this view. This view is also particularly useful when obesity, emphysema or chest wall deformity prevents satisfactory transthoracic views from being obtained.
It is used to measure IVC variability to assess volume status, diagnose small pericardial effusions, and measure RV free wall thickness to diagnose chronic Cor pulmonale.
Situs: Position, especially normal or original position (Fig. 1.28).
What will You See in Normal Echo?
Situs solitus: The aorta as rounded pulsatile red structure towards left of mid line and inferior vena collapsible blue towards right of midline. We can see IVC collapsing with inspiration.
Exercise:
Try to see plain X-ray chest and see position of liver and stomach bubble: Now comment on Situs.
Situs Inversus: The IVC goes to left and aorta comes to right.
Situs Ambiguous: IVC/Aorta goes on same side. Some times IVC cannot be seen only aorta is seen, Careful observation will show a collapsible blue vessel behind aorta.
Similar to apical view, we see this view with U/D invert.
Keep the probe in subxiphoid area to see Situs then slowly rotate the probe by15 degree and lift it up till you see two chambers of atria. This view is similar to 4 C apical view. You can see flap valve of foramen and pulmonary veins entry in left atria in a normal heart.
Rotating the probe clockwise will bring another part of atrial septum in the view. You see the entry of superior and inferior vena cava entering in to right atria.
In these views, try to notice color flow across the PFO. Usually a severely cyanosed baby with TOF physiology will show right to left shunting shown as blue color. Tricuspid atresia and total anomalous pulmonary venous drainage (TAPVC) will show only right to left shunting (Figs 1.32 and 1.33).
In severely cyanosed child if you see a bidirectional PFO with predominant left to right shunt, always try to rule out transposition of great vessels.
Usually in new-born you will see some kind of inter-atrial communication which could be a foramen ovale, multiple fenestrations or ASD. You need not to panic as these holes are only rarely hemodynamically significant.


Fig. 1.29B: Sagittal section of atrial septum. See disappearance of baldness of RA and entry of superior and inferior vena cava (bicaval view). On Left side note LA and RPA is above LA


Fig. 1.32: Shunt in above patient across ASD is shown which is red in color; that means left to right shunt. Red color means blood flow direction is towards probe; as the probe is downwards towards RA, which means the shunt is from LA to RA

Fig. 1.33: Subcostal view showing ASD with right to left shunt in a newborn with TAPVC. As color is blue, the flow of blood is away from transducer, which means the shunt is from right atrium to left atrium
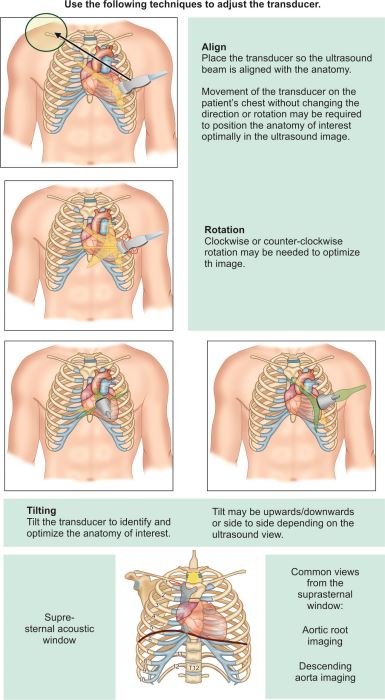
The special view is used to look at superior mediastinum. What are the structures in the superior mediastinum?


Figs 1.35A and B: Suprasternal view 2D image; showing normal arch and descending aorta. (IA-Innominate artery; LCA-Left carotid artery; LSCA–Left subclavian artery; RPA-Right pulmonary artery; DA-Descending aorta)

Fig. 1.36: Normal suprasternal view showing color flow in descending aorta along with 3 neck vessels
- Coarctation of aorta
- Pulmonary arteries
- Superior vena cava
- Vertical vein of supracardiac TAPVC.


Fig. 1.38: CW Doppler across coarctation segment in the above mentioned patient, showing a peak gradient of 83 mm Hg. As the flow in descending aorta is away from probe (blue color), the Doppler envelope is below the baseline)
To obtain a good suprasternal view, keep a pillow under the shoulders. The probe is kept in the suprasternal notch with marker towards left shoulder and posteriorly, This view shows arch in its longitudinal length, origin of great vessels and isthmus (area adjoining the origin of left subclavian artery) which is the commonest place for coarctation of aorta. The color flow across the isthmus is blue and smooth. It is turbulent in coarctation and you will see a mosaic pattern.
Sometimes there may be a mix of red and blue. This is due to flow reversal. Usual cause of flow reversal in babies is patent ductus arteriosus. If you put a pulse Doppler you will see signal above and below the baseline. One should also look for AP window, cerebral AV fistula, aortic regurgitation and aorto-LV tunnel.
Tutorial Echocardiography Functional Echo in Nicu: Cardiac Output and PA Pressure Section I: Cardiac Output
Learning Objectives
Why to measure cardiac output (CO)?
How to measure CO?
What is the co relation of inferior vena cava (IVC) diameter and intravascular volume status?
Cardiac Output (CO)
Introduction
Optimal end organ oxygen delivery is important component of management of any critical child. This mainly depends on systemic blood flow and cardiac output. Measurement of cardiac output thus helps a lot in assessing inotropic need. Blood pressure mainly depends on cardiac output and systemic vascular resistance (SVR) and thus any change in BP will be either due to CO or SVR. The two main determinants of oxygen delivery are arterial oxygen concentration, which is easy to measure, and systemic blood flow (SBF), which is difficult to measure but can be done by noninvasive methods as functional ECHO (fECHO) measuring CO.
Mean arterial pressure (MAP) = CO × SVR
The more critical variable is cardiac output since it is a major determinant of overall oxygen delivery. Always confirm normal cardiac anatomy prior to the assessment of cardiac output, and in particular exclude aortic valve disease and assess ductal patency.
Ways to calculate and judge CO:
- Left ventricle output (LVO)
- Ventricular functions
- Right ventricle output (RVO)
- Superior vena cava (SVC) flow
- Inferior vena cava (IVC) volume
- Clinical surrogates.
Methods: Measurement of Cardiac Output
Introduction
As we know a normal human heart has two ventricles. With every systolic contraction ventricles throw about 60% of blood which was collected during diastole, into the great vessels. The volume of blood which reaches to the lungs via right ventricle pulmonary blood flow or we can call it Qp. The volume of blood which goes to aorta via left ventricle, is systemic blood flow or Qs.
Left Ventricle Output (LVO)
Postnatally, ventricles work in series and left ventricular (systemic) output (Qs) is normally the same as right ventricular (pulmonary) output (Qp). Cardiac output measurements are related to the left ventricle.

It is usual in neonatology to represent ventricular output as an index in relation to body weight, i.e. ml/kg/min. Range of LVO (170–300 mL/kg/min).
How to Measure LVO?
Method
- Measure the cross-sectional area of aortic root at the hinge point of aortic valve in systole, view: PLAX (Fig. 1.41).
Views
Apical 5 chamber view at apical window. Apply color Doppler and then measure the velocity of blood flowing out of Left Ventricle (LV) and then trace the VTI (Velocity time integral) to calculate the LVO/LV index.
(Most of the machines will do calculation on their own once you taken a measurement).
Technique to assess LVO involves measuring the means velocity of blood flow in the ascending aorta using either pulsed or continuous wave (CW) Doppler, and determining the diameter of the aortic root using 2D or M-mode.

Fig. 1.39: Apical 5 chamber view: Pulse wave Doppler at the start of ascending aorta just above the aortic valves towards aortic side. The pulsatile flow of aorta is seen below the baseline

It is important to remember that this method is actually measuring LVO rather than total or effective systemic cardiac output.
Why it is important to make this distinction? How the left ventricular cardiac output can differ from systemic output? In the presence of left-to-right ductal shunting: More blood is flowing through the ascending aorta than is reaching the descending aorta beyond the duct.
With a closed duct: LVO equals systemic cardiac output.
The preterm myocardium has been shown to have a limited ability to respond to an increased afterload during normal postnatal adaptation, there are large changes in ventricular workload in response to the change from low intrauterine vascular resistance to increased extra uterine resistance. The combination of an immature myocardium and high vascular resistance may be the cause of these low flow states.

Fig. 1.41: Aortic diameter to be measured at Aortic root. Either in 2D (as shown in figure) or in M-Mode. 2D view in parasternal long axis
Patency of the arterial duct is common in newborns, particularly in the premature neonate, it is important to recognize the influence of left-to-right ductal shunting in left ventricular cardiac output and on overall systemic blood flow—the blood flow variable of greatest importance in determining systemic oxygen transport (Fig. 1.42).

Fig. 1.42: Shows the effect of Left-to-right PDA shunting on LVO and relationship to ascending aortic flow and systemic flow (Qs). Pulmonary flow (Qp) = LVO = ascending aortic flow = PDA shunt flow + Qs
31Assuming there are no intracardiac shunts causing recirculation through the pulmonary vascular bed, LVO is equal to pulmonary blood flow (Qp). Qp is, in turn, the combination of systemic blood flow (Qs) returning to the right heart from the systemic circulation and any left-to-right ductal blood flow (QPDA). This all returns to the left heart.
That is: LVO = Qp = Qs + QPDA
The left-to-right ductal shunt does not participate in overall systemic blood flow and thus is not a contributor to systemic oxygen transport. This is the concept of the ductal steal.
In the newborn, if left to right shunting PDA is present, then Qp/Qs will be high and so pulmonary venous return would be high leading to increased volume to LA and LV and thus leading to increased LVO. When the duct closes, LVO falls to normal levels as systemic blood pressure rises towards normal. If large left-to-right ductal shunt persists, continued coronary arterial steal may impair left ventricle function and thus LVO will eventually decrease and even fall below normal. This can be called a hemodynamically significant duct and needs urgent intervention.
Functional ECHO (fECHO) and Clinical Applications
fECHO is useful and in fact a necessity to take early and appropriate action.
- In cases of hemodynamic instability, cardiac output measurements can determine the effectiveness of inotropes and assist in adjusting the therapy.
- Cardiac output determination is a more sensitive reflection of the cardiovascular hemodynamic than blood pressure alone. Blood pressure may remain within normal limits while cardiac output is significantly impaired because systemic vascular resistance increases.
- Cardiac output may be impaired with ventilator support, particularly with higher positive end–expiratory pressure (PEEP) or high mean airway pressure (Paw). Measuring cardiac output by echo Doppler can therefore assist in determining the optimal PEEP or Paw.
To prevent injury to any organ including the brain, it is the volume of blood that is flowing through that organ that must be improved; and not just the pressure at which that blood is delivered. Early vulnerability of the very preterm infant to low systemic flow states may be due to an immature myocardium struggling to adapt to a high extrauterine vascular resistance. When this is compounded in the vulnerable early period by high intrathoracic positive pressure and a large shunt of blood out of the systemic circulation through the Ductus Arteriosus, it increases the chances of injury to vulnerable organs.
Right Ventricle Output
The same principles used in LVO calculation can be used to determine output from the right ventricle (RVO). The diameter of the pulmonary artery is determined from the hinge points of the pulmonary valve seen in PSAX view. Some prefer a tilted PLAX view of the pulmonary valve and artery.
32The pulsed Doppler is placed at pulmonary valve and the area under the Doppler flow curve is assessed (pulmonary artery flow velocity integral). RVO is then calculated same as LVO.
Interpretation of Values
PDA Shunting Left-to-Right
Expect increased LVO but decreased overall systemic blood supply and decreased RVO.
PFO Shunting Left-to-Right
Expect rise in RVO ± decreased LVO and overall systemic cardiac output.
Role of Structural Defect in Heart
The any measurement of cardiac output may be fallacious.
It should be remembered that turbulence from pulmonary stenosis invalidates the technique, and turbulence in the pulmonary artery from left-to-right ductal flow can disturb the flow pattern. RVO should equal LVO when there is no shunting across the duct or across the oval foremen. LVO output is raised by pure left-to-right ductal shunting, but RVO is not, indeed, it may be reduced if there is so much ductal steal that effective systemic cardiac output is reduced, thereby reducing systemic venous return. However, RVO is also affected by interatrial shunting across the patent oval foramen. Low values of RVO (<150 mL/kg/min) are found in low output states.
Section II: Will Fluid Challenge will Increase the Cardiac Output?
Introduction
“Optimization of cardiac output is achieved by giving fluid challenges as first step. Treatment becomes more helpful if we can gather evidence of hypervolemia on echocardiography.”
Inferior Vena Cava (IVC)
There are many bedside parameters that indirectly quantify the intravascular volume as CVP, bedside ultrasound, etc.
The IVC diameter and distensibility index give the indirect idea of intravascular volume and also the RV and LV volumes give idea of the volume and helps in the management.
View
Subcostal window: With pointer pointing at 12'O clock position (Figs 1.43A and B).


Estimation of CVP by assessing IVC diameter and its degree of respiratory variation
| ||
|---|---|---|
IVC
| IVC respiration variation (with inspiration)
| CVP estimation
|
Diameter <8 mm | >50% collapse | Low (fluid responsive) |
Diameter <8 mm | < 50% collapse | Lower normal (may give fluid) |
Diameter >8 mm | < 50% collapse | Normal |
Diameter >8 mm | No inspiratory collapse | High (RV failure, high pulmonary pressures, hypervolemia) |


Figs 1.45A to C: Evaluation of cardiac preload and circulating fluid status must always come from an integrated assessment of various echocardiographic findings (rather than assessment of a single parameter). Figure 1.45C shows A child with heart failure and distended IVC, note the minimal IVC variability with respiration in this patient suggestive of volume overlaod
Key findings in favor of hypovolemia on 2D imaging:
- LV and RV of small dimensions and hyperkinetic
- Small LV end – systolic and end – diastolic areas
- Increased LV ejection fraction shortening (>70%)
- Small IVC diameter with wide respiratory variation.
Clinical Surrogates:
- Invasive and noninvasive blood pressures not correlated well with low systemic blood flow so has to be used with other noninvasive parameters as LVO/SVC flow for proper interpretation and management
- Urine output
- Capillary filling time (central and peripheral)
- Peripheral and central temperature difference
- Serum Lactates
These have to be co-related with fECHO parameters
Following table is an example how both the information can be helpful in proper management of Shock in newborn.
Normal/High BP
| Low BP
| |
|---|---|---|
Normal/High CO | Observe | Afterload pressors (dopamine, epinephrine, vasopressin) |
Low CO | Preload, afterload, or contractility Inodilators (milrinone, dobutamine) | Preload, afterload, or contractility Combined (dobutamine, dopamine, epinephrine) |
Section III: Assessment of Pulmonary Arterial Pressures
Methods: There are various noninvasive methods used to assess pulmonary artery pressure (PA) and we will discuss here the most commonly used.
- TR jet velocity
- Peak gradient across shunts (like PDA, VSD )
- Right ventricular systolic time interval (RVOT acceleration time)
- Pulmonary regurgitation gradient.
- Measuring TR velocity—Echo Doppler techniques have made it easy to assess PA pressures in a noninvasive way with reasonable accuracy. The principle used in measuring PA pressure from TR jet is as follows –Peak PA pressure = RV pressure (if there is no pulmonary stenosis)RV pressure – RA pressure = TR jet gradient (4 V2, where V is the TR jet velocity)The most important point in assessing the TR jet Doppler is alignment has to be accurate and dense envelope of Doppler should be obtained. Most common view is apical chamber and PLAX view with probe tilting down. Few TR jets are better seen in PSAX view with focus on tricuspid valve.Fig. 1.46: TR jet velocity across TR, note the TR velocity of 3.17 m/sec and now a days machines calculate gradient automatically by using 4 V2 formulae (that means gradient of 40 mm Hg). So PA pressure in this patient will be 40 + RA pressure using the above mentioned equation. RA pressure in children will be equal to CVP and can be assumed to be 5–10 mm Hg. In real practice, RA pressure value is so less in comparison to TR jet that it can be almost ignored especially if IVC is not distended
-
This is also an easy and reliable method to assess PA pressures. The concept is that if we can identify a pressure difference between RV and LV by Doppler gradient, then Peak PA pressures can be estimated.Systolic BP = LV pressure (if no aortic stenosis)Peak PA pressure = RV pressure (if no Pulmonary stenosis)VSD gradient = the difference between LV and RV pressure (LV–RV pressure)Peak PA pressure (RV pressure) = LV pressure (systolic BP)–VSD gradientSo if a child has a systolic BP of 100 mmhg and VSD gradient is 20 mm Hg, then Peak PA pressure will be 100-20 = 80 mm Hg.Similar principle will apply to PDA gradient as this will be a difference between aorta and pulmonary artery.Peak PA pressure = systolic BP—PDA gradientFig. 1.50: PSAX view shows a CW Doppler across PDA to assess PDA gradient. PDA is red in color in this view as PDA is flowing towards probe. Doppler signal will also be above baseline due to flow being towards the probe. Here PDA gradient is 41 mm Hg and SBP is 80 mm Hg, so peak PA pressures will be 80-41 = 39 mm Hg
-
This is based on pulmonary artery Doppler curve. It is performed by putting a pulse Doppler across pulmonary valve in PSAX view and measure the time to peak velocity. It gives an estimate of mean PA pressures. It has limitation of reproducibility. This is also not used in patients with congenital heart diseases.The formulae used for calculating mean PA pressureMean PA pressure = 90 – (0.62 × acceleration time)
- Pulmonary regurgitation jetUsing pulmonary regurgitation jet to assess diastolic PA pressure has limited uses. PR jet at end diastole reflects the pressure difference between PA and RV at end diastole. Adding RA pressure will give an estimate of diastolic PA pressures (Figs 1.52A to C).


Fig. 1.52B: Shows a CW of PR jet, gradient of 5 mm Hg at end diastole (above the baseline trace). Adding RA pressure to this value will give us a diastolic PA pressure

Fig. 1.52C: Above mentioned patient of PR also had TR which was collaborative with normal PA pressure by TR velocity criteria also
Appendix I
Transthoracic Echo-Doppler Report
Generating a Normal Report
Let's start making report.
Transthoracic Echo-Doppler Report
Cardiac Position:
Abdominal Situs
Cardiac apex
Cardiac Segments:
Atrial Situs
………Loop Ventricle
………..related great vessels
Atrio-ventricular connection
Ventriculo-arterial connection
Two Patent AV Valve
Veins and Atria:
Interatrial septum
Right atrial size
Left atrial size
Systemic venous drainage
Pulmonary venous drainage
Atrioventricular Canal:
Mitral valve
Tricuspid valve
Conotruncus:
Pulmonary valve
Aortic valve
Ventricles:
Left ventricle
Right ventricle
Interventricular septum
Great Arteries:
Coarctation of aorta
Valvar aortic stenosis/supravalvar aortic stenosis
Function:
Lv function
Rv function
Pericardium:
Pericardial effusion
Shunts:
Atrial shunt
Ventricular shunt
Ductus detected
TV velocity
MV velocity
PV velocity
AV velocity
Mitral regurgitation
Tricuspid regurgitation
Aortic regurgitation
Pulmonic regurgitation.
Final Interpretation (For normal report, correct option is given in black font)
Cardiac Position:
Abdominal Situs: Optional words: Solitus, Inversus, Ambiguous
(Meaning of Situs: Position, especially normal or original position, as of a body organ)…

Evaluation of Situs: Subcostal View
Coronal section (probe pointer—towards left; direction towards spine.)
What will you see in normal echo?
Situssolitus: The aorta as rounded pulsatile red structure towards left of mid line and inferior vena collapsible blue towards right of midline. You can see IVC collapsing with inspiration.
Exercise: Try to see plain X-ray chest and see position of liver and stomach bubble: comment of situs.
Situs inversus: The IVC goes to left and aorta comes to right.
43Situs ambiguous: IVC/Aorta goes on same side. Some times IVC cannot be seen only aorta is seen. Careful observation will show a collapsible blue vessel behind aorta.
Cardiac Apex
Options: Levocardia, Dextrocardia, Mesocardia:

Exercise: See the cardiac apex.
Cardiac Segments:
Atrial Situs
………Loop Ventricle
………..related great vessels
Atrio-ventricular Connection
Ventriculo-arterial connection
Two Patent AV Valve
Atrial Situs:
Option: Solitus;
Inversus, Ambiguous
Atrial situs follows visceral situs.
Solitus: Right atria in right side; Left atria in left side.
SitusInversus: Right atria on left side; Left atria on right side
Loop of ventricles:
Options: D Loop Ventricle; L-Loop ventricles
D-Loop Ventricles: Right ventricle on right side; Left ventricle on left side;
L-Loop Ventricles: Left ventricle on right side; Right ventricle on left side

Great Vessels Relationship:
Options: Normally related (Cup and Saucer arrangement); inversely related. D malposed aorta; L malposed aorta

Atrio-ventricular Connection:
Options: AV Concordance; AV discordance; Univentricular Connection
AV concordance: Right atria connected to right ventricle; Left atria to left ventricle
AV Discordance: Right atria to left ventricle; Left atria to right ventricle
Univentricular AV connection: One ventricle is connected to both atria

Ventriculo-arterial connection
Options: VA Concordance; VA discordance (D TGA); DORV; Truncus arteriosus; pulmonary atresia; Aortic atresia
VA Concordance: Aorta arising from LV; Pulmonary artery from RV
VA discordance: Aorta from RV; PA from LV
DORV: Double outlet right ventricle: Both vessels are committed to RV partially or completely
Truncus arteriosus: A single artery (Truncus) from Ventricles. Pulmonary artery and coronary artery are arising from it. Trunk continues upward and posteriorly as the ascending aorta; usually, the blood of both ventricles flows into common overriding truncus through a ventricular septal defect, and is distributed in aorta and pulmonary artery at same pressure and saturation leading to increased pulmonary blood flow.
Pulmonary atresia: Pulmonary valve not seen, PDA or some extracollateral artery supplies the pulmonary arteries (Decreased pulmonary blood flow).

AV Valve
Option: Two patent AV valve; common AV valve; tricuspid atresia; mitral atresia.

Appendix II
Echo views and structures which can be seen in Table 1.1.