

INTRODUCTION
Optical coherence tomography angiography (OCT angiography, OCTA) is a new and noninvasive diagnostic tool in detecting changes in microvascular circulation. It is based on two innovative technologies such as Split Spectrum Amplitude Decorrelation Angiography—SSADA algorithm and Motion Correction Technology—MCT protocol. OptoVue Company introduced the first OCTA system, AngioVue, at XXXII Congress of European Society of Cataract and Refractive Surgeons (ESCRS) in London, 2014. This novel approach recognizes early retinal and macular disorders differently, and is becoming a part of the standard care in everyday clinical practice in ophthalmology.
OptoVue has developed a completely new and noninvasive approach in microvascular imaging and blood vessels visualization. They can be identified by detecting the movement of the red blood cells, erythrocytes, thus showing the blood flow in specific retinal layers. Microvascular changes can be visualized by using OCTA, a highly sophisticated device that can also visualize the presence of ocular blood flow in the vessels. It is not only modified and improved conventional structural OCT, but a device providing both structural and functional information and the precise location of pathological blood flow. OCTA shows potential efficacy in the evaluation of common disorders involving retinal neovascularization. The system is fundamentally different in comparison to the conventional and well-known fluorescein angiography, since it portrays red blood cells movement, its focus is not on detecting the walls of blood vessels, but on detecting the blood flow. It does not require contrast dye injection, so it is completely noninvasive.
The AngioVue Imaging System acquires different scan sizes with each volume scan acquired in less than 3 seconds. Two imaging volumes are obtained consecutively to perform motion correction later in order to remove the saccadic artifacts.
Segmentation of retinal layers is automatically produced in order to recognize the vascular layers of interest. It is helpful in detecting pathological changes at different depth. In comparison to well-known traditional angiography techniques, AngioVue imaging protocol allows visualization of microvasculature within specific retinal layers without the blurring effects of staining. It provides high-resolution imaging and better penetration. The result is the image that could be segmented and isolated by using the AngioAnalytic software. It provides information that helps to better understand images of inner vascular and outer avascular retinal layers. This imaging system produces images of retinal and choroidal microvasculature and determines early from which layer pathology originates, making it possible to establish retinal changes diagnosis at early stages.
The OCTA shows structural and functional changes in the retinal vascular network in vivo without administration 2of contrast dye. The result is a precise image of the blood flow in the selected area. It is very important to point out that all pieces of information obtained by OCTA are completely different from those acquired by fluorescein angiography (FA). AngioVue system is capable of detecting blood flow without showing blood vessels walls, by mapping erythrocyte movement. AngioFlow imaging is very fast and does not require pupil dilation. The entire recording process takes only a few minutes. This technique is a noncontact diagnostic procedure. The capillary abnormalities are easily seen. No leakage, staining or pooling is present, and the image may seem ‘too sharp’ or ‘too dry’. OptoVue Avanti high-speed SD-OCT imaging system is a foundation to build the AngioVue imaging system.
The OCTA shows the vascular flow of the retina at three scan sizes: 3 × 3 mm, 6 × 6 mm, and 8 × 8 mm. At 3 × 3 mm and 6 × 6 mm scan sizes, the vessel imaging is clear. For a more detailed analysis, the 3 × 3 mm scans are recommended. The images of OCT angiography with 8 × 8 mm scan are recommended for performing large area scans of the retina giving more of an overview of selected retinal area.
Split Spectrum Amplitude Decorrelation Angiography—SSADA algorithm is developed by David Huang, Center for Ophthalmic Optics and Lasers, Portland, Oregon. The algorithm uses consecutive OCT scans and compares each OCT scan with the subsequent one. The SSADA algorithm uses multiple spectra from single B-scan to improve image quality. Thus, the number of repeated B-scans required for high-quality imaging is reduced. By observing the changes in the pixel intensity at a selected area, a decorrelation value could be generated which means that the marker shows whether there is blood motion or not. It means that the image could present either a highly intensive activity of the blood flow or the regions without any movement and capillary vitality. The SSADA algorithm then generates a flow image, or a functional image of this B-scan. Taking a large number of B-scans make it possible to generate a 3D map of retinal vasculature on the AngioVue system.
Motion Correction Technology (DualTruc Motion Correction Technology) is one of many protocols which distinguishes AngioVue system from all the others. MCT was invented by James Fujimoto. MCT provides high-quality imaging through two levels of motion improvement by video tracking (transversal correction) and longitudinal correction after the imaging process. The first level of this powerful MCT algorithm is based on a real-time correction for saccades, blinking or eye drifting; the second level occurs during postprocessing of imaging and corrects smaller levels of motion distortion (<100 µm). Second, two-level approach reduces motion artifact and optimizes the imaging signal.
The SSADA algorithm offers the best quality OCT angiography images. This technology achieves higher signal-to-noise ratio and better and more detailed visualization of the vasculature.
ANATOMIC STRUCTURE OF THE HEALTHY RETINA
Optical coherence tomography image processing of a healthy retina provides the following retinal ‘slabs’: The inner limiting membrane (ILM), outer boundary of the inner plexiform layer (IPL), the outer boundary of the outer plexiform layer (OPL), and Bruch's membrane (BM) (Fig. 1.1).
The internal limiting membrane presents basal membrane created by Müller cells (MC). The retinal nerve fiber layers (RNFL) are axons of the cells forming the optic nerve. The IPL consists of connections between the axons of bipolar cells and dendrites of ganglion and amacrine cells. The inner nuclear layer (INL) consists of the nuclei of the amacrine cells, bipolar and horizontal cells. The outer nuclear layer (ONL) contains the nuclei of the photoreceptor cells, the synapses between the rod, and cone cells from one side and the bipolar cells from the other side. The ONL consists of the bodies and nuclei of photoreceptor cells. The outer limiting membrane (OLM) separates the inner segments from the photoreceptors nuclei. The photoreceptor layer contains the outer and inner segments of rods and cones. The retinal pigment epithelium (RPE) layer consists of a single layer of cuboid situated under the photoreceptors cells closely interacting with them (Figs. 1.2 and 1.3).
The retina is composed of three vascular networks, one superficial and two deep ones. OCTA system cannot separately visualize two deep layers, so they appear as a uniform layer. Thus, OCTA angiography shows two retinal layers, the superficial and deep retinal networks. The superficial vascular network is located in the ganglion cells layer and the RNFL. The resolution of OCTA SSADA protocol recognizes the superficial vascular network 60 µm below the ILM. The deep vascular network is localized between the INL and the OPL. The protocol recognizes deep vascular layer 30 µm from the internal plexiform layer.3
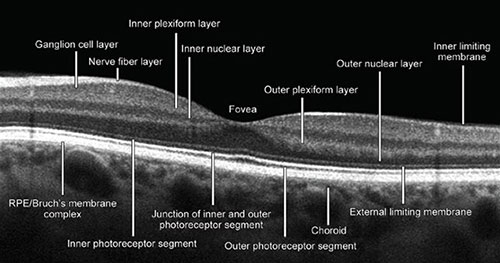

Fig. 1.1: Optical coherence tomography (OCT) B-scan. The image of macula with all anatomic structural layers (slabs) whose understanding and recognition is crucial for proper interpretation of OCT and OCT angiography image. (RPE: retinal pigment epithelium)
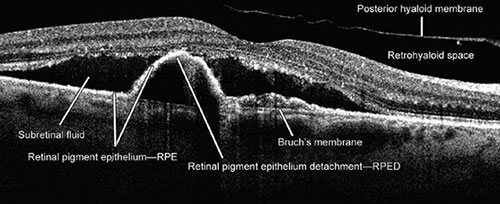
Fig. 1.2: Presentation of pathological changes which could be seen and visualized by the optical coherence tomography. Subretinal fluid, retinal pigment epithelium detachment, and the detachment of the posterior hyaloid membrane can clearly be seen. (RPE: retinal pigment epithelium; RPED: retinal pigment epithelium detachment)
The superficial vascular network is composed of many dense, linearly arranged capillaries radiating towards the fovea, forming the superior and inferior capillary arcades. The capillaries are arranged and interconnected in a way that forms a fine, regular lacy-shaped or spider-web-shaped network around the central oval foveal avascular zone (FAZ). The thickness of the blood vessels is homogenous, without dilated capillaries, capillary loops or meanders. The OCTA image shows blood vessels as white, thread-like structures forming a symmetrical network against a dark background.
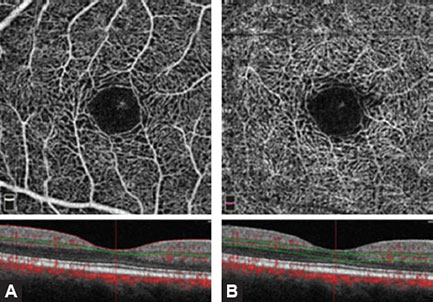
Deep vascular network of the inner retina consists of densely distributed, tiny, heavily branched capillaries, connected with superficial layer by anastomotic capillaries. The deep vascular network is denser and rougher than the superficial vascular network. They both form a pattern around the FAZ (Figs. 1.4A and B). The thickness of blood vessels is also the same between the two networks which are connected by small slanted interconnection anastomoses.

Fig. 1.3: Pathological changes seen by the optical coherence tomography. The image shows the cystoid macular edema and subretinal fluid.
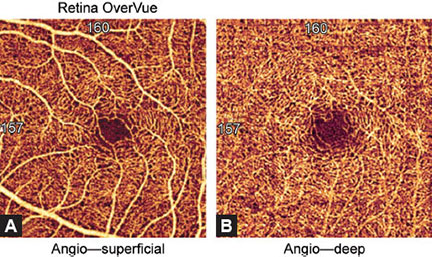
Figs. 1.4A and B: Optical coherence tomography angiography image of the superficial and deep vascular network of a normal and healthy eye (3 × 3 mm). Spider-web-shaped capillaries form a network around the central foveal avascular zone (FAZ).

Figs. 1.5A to D: Accurate interpretation of optical coherence tomography (OCT) and OCT angiography (OCTA) images always requires comparison of simultaneous imaging obtained by (A) OCT B-scan, (B) en face OCT, (C) retinal thickness map, and (D) OCTA split spectrum amplitude decorrelation angiography algorithm. It is of crucial importance to find out structural and functional information in tandem. (A) A large area of retinal pigment epithelial detachment (PED), subretinal fluid, and the detachment of enlarged and thickened posterior hyaloid membrane can be seen in figure. Figure B explains a big hyporeflective zone which corresponds to the PED area. (C) emphasizes the importance of retinal thickness map imaging by showing an increased retinal thickness. Central macular edema (439 µm) and area of paramacular edema are associated with the presence of subretinal fluid. (D) demonstrates the presence of the neovascular membrane in the macular center.
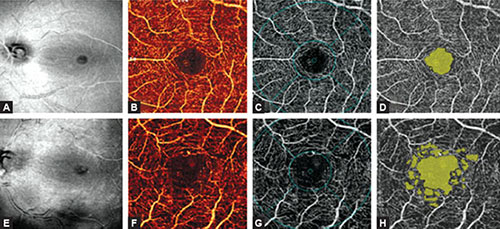
Figs. 1.6A to H: Besides en face optical coherence tomography (OCT) and OCT angiography (OCTA), detailed diagnostic procedure of the eyes requires AngioAnalytics assessment of the FAZ and the detection on nonflow areas in selected region. (A to D) The images of a healthy eye. (A) En face OCT shows a healthy and regular macula and the optic disk with normal flow and normal big blood vessels. (B) The superficial vascular network demonstrates regular structure and appearance on en face angiogram. (C) The en face image of foveal and parafoveal areas. (D) AngioAnalytics shows the FAZ (yellow color) corresponding to the central nonflow region. There are no vascular activities. The foveal avascular zone (FAZ) is regular in size and shape. The parafoveal avascular zones (dropout zones) are not visualized. (E to H). The OCTA images of an eye with nonproliferative diabetic retinopathy. (E) En face OCT shows no evident pathological events. (F) The superficial vascular network displays enlarged and irregular size and shape of the FAZ and enlargement of parafoveal intercapillary areas which are known as ‘dropout zones’. (G) En face OCT angiography of foveal and parafoveal area. The FAZ is significantly enlarged in comparison to the healthy eye. (H) AngioAnalytics shows irregular outline of the FAZ, as well as numerous parafoveal areas of capillary dropout. The changes are typical and pathognomonic for nonproliferative diabetic retinopathy.
OPTICAL COHERENCE TOMOGRAPHY ANGIOGRAPHY OF THE HEALTHY RETINA
The superficial inner retinal angiogram of the healthy retina, from the inner retina to the outer retina shows the avascular vitreous and no flow above the ILM, so the en face OCTA image appears black. There are large blood vessels in the superficial vascular plexus, while fine densely arranged capillary network is found in the deep plexus. There is no flow in the FAZ. The outer retina is avascular and OCTA imaging shows it as a dark avascular zone. But, we must be very careful in interpreting this image, since flow projection artifacts from the inner retina can be seen due to shadows cast by the blood flow. These artifacts must be suppressed by post-processing software. The choriocapillary layer shows confluent flow, so lobular structure of the choriocapillaris is difficult to recognize because it is densely packed within the macula. The rougher lobules outside the macula would be recognized more easily. The angiogram of deep choroid shows large blood vessels, but this layer is still more difficult to interpret due to flow projection, shadowing, and villous artifacts. Therefore, a part of inner, large choroidal vessels appears as a dark region on both en face OCT angiography and structural OCT. FAZ cannot be visualized in the outer retinal layer nor in choriocapillaris.
In order to detect and analyze standard retinal pathology more efficiently and simply, it is very important to understand the automated segmentation algorithm and layer boundaries within AngioVue imaging system. The automated segmented reference planes could be manually corrected and adjusted depending on imaging requirements. With these options it is possible to clearly define the exact location of pathological processes, their size, and progression within retinal layers. The artifacts and errors could be suppressed and provide clear visualization of vascularization at a specific depth.6
AngioVue protocol recognizes:
- Superficial vascular plexus: 3 µm below the internal limiting membrane (inner limiting membrane) and 15 µm below the internal plexiform layer (inner plexiform layer) (Figs. 1.7A and B)
- Deep vascular plexus: From 15 µm to 70 µm below the IPL
- Outer retina: 70 µm below the IPL to 30 µm below the RPE (Figs. 1.8A and B)
- Choroidal layer: It is located from 30 µm to 60 µm below the RPE.
Do not forget to consider the age of the patient. Changes in normal structure and function of the retina are evident during aging. It is very important to compare the right eye to the left eye. The comparison always gives a lot of information to get the final decision on whether the changes are normal and expected or pathological.
OCTA OF A HEALTHY EYE IN A 24-YEAR-OLD PATIENT
Figures 1.9A to D show the OCTA of a healthy eye in a 24-year-old patient.
OCTA OF A HEALTHY EYE IN AN 82-YEAR-OLD PATIENT
Figures 1.10A to D show the OCTA of a healthy eye in an 82-year-old patient.
ANALYSIS OF CAPILLARY LAYERS USING OCTA ANGIOANALYTICS
The OCTA is an irreplaceable diagnostic tool in everyday clinical practice for vascular plexuses visualization and detection of blood vessel flow changes. AngioAnalytics software has recently been developed and approved. It enables additional quantitative evaluation of retinal vascular abnormalities. The data can be saved for comparison and subsequent analysis. AngioAnalytics provides measurements and analysis of the flow areas and the nonflow areas, it generates capillary density map and quantifies the size and appearance of the FAZ.
Flow Area
Flow area measurement is useful in monitoring the development of the neovascular membrane and in patients treated with anti-vascular endothelial growth factor (VEGF) therapy and steroids.
Figs. 1.7A and B: (A) Optical coherence tomography angiography (OCTA) of the superficial vascular plexus (3 × 3 mm). White, thread-like structures against a dark background present the blood flow. Centripetal confluence of the capillaries that form a spider-net symmetric network around the central round avascular zone [foveal avascular zone (FAZ)] can be seen. OCT B-scan marks a layer within the inner retina (between the red and green line), which corresponds to the location of the superficial vascular plexus. B-scan allows depth control of the vascular plexus. (B) OCTA of the deep vascular plexus (3 × 3 mm). A deeper network consists of smaller and less filamentous, tangled capillaries around the FAZ. B-scan shows the point of retinal depth (between two green lines) where deep vascular network spreads.
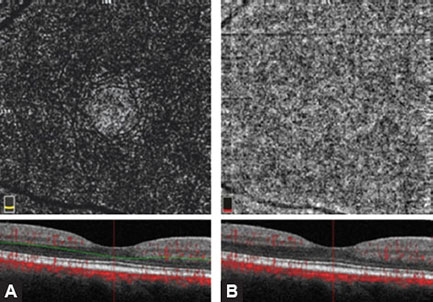
Figs. 1.8A and B: (A) Optical coherence tomography angiography (OCTA) of the outer retina (3 × 3 mm). A dark, avascular zone of the outer retina is shown. The hyperreflective areas present the artifacts caused by flow projection from the inner retinal blood vessels toward the retinal pigment epithelium. The analysis of this layer requires caution since the flow projection artifacts caused by flickering shadows may mimic the presence of capillaries or neovascularizations in the avascular layer. OCT B-scan shows retinal depth that corresponds to outer retina. (B) OCTA of the choriocapillary layer (3 × 3 mm). The flow is presented as a rough lobular structure where capillaries are densely packed.
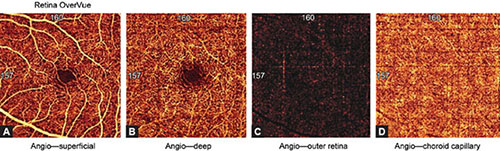
Figs. 1.9A to D: Optical coherence tomography angiography split spectrum amplitude decorrelation angiography protocol of a healthy eye (3 × 3 mm). Illustrations of the (A) superficial capillary plexus, (B) deep capillary plexus, (C) outer retina, and (D) choriocapillary layer. Inner retinal layers show normal vascular texture and normal size of the foveal avascular zone (approximately 0.4 mm in diameter). Avascular zone of the outer retina is dark with minimal visualization of flow projection artifacts. The choriocapillaris vasculature is lobular and dense.
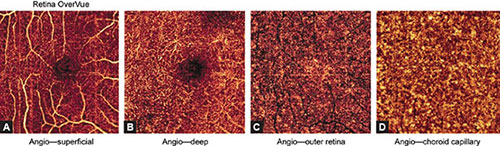
Figs. 1.10A to D: Optical coherence tomography angiography split spectrum amplitude decorrelation angiography protocol of a healthy eye in 82-year-old man (3 × 3 mm). (A) superficial vascular capillary plexus, (B) deep vascular capillary plexus, (C) outer retinal layer, and (D) the choriocapillaris layer are illustrated. Inner retinal layer shows normal vascular network and normal foveal avascular zone considering patient's age. In comparison to Figure 1.9, sclerotic changes of blood vessels and capillaries and their sparse appearance in two vascular plexuses can be visualized. Outer retinal avascular zone shows more intensive flow projection artifacts in comparison to the same zone in a young adult person. The choriocapillaris shows rough and lobular vascularization.
Unlike the well-known fluorescein where pooling or leakage of the contrast dye masks the capillary network morphology, OCT angiography is dye-free, and allows clear visualization of the flow within retinal vessels in the selected segments. The operator should clearly draw the boundaries of the analyzed segment that is automatically identified by the software and the flow of the selected region is calculated. All the data are stored for comparison and analysis (Figs. 1.11A and B).
Nonflow Area or Vascular Dropout Area
Nonflow areas are regions with vascular damage, ischemia, or vascular dropout. Precise measurements, marking, and region comparison offer new possibilities in monitoring ischemic retinopathies with different etiology. SSADA protocol shows regions with nondetectable separate flow in the superficial and deep vascular plexus.8
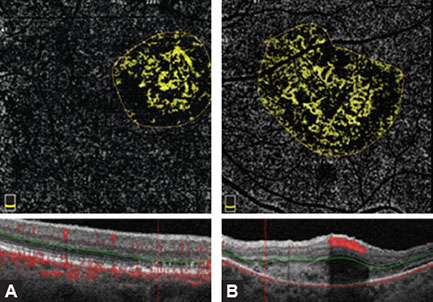
Figs. 1.11A and B: Optical coherence tomography (OCT) angiography AngioAnalytics of the flow in the outer retina in two examples with choroidal neovascularization (CNV). By choosing the specific area of interest, the software analyses of blood vessels shows regions with flow using the yellow color, while avascular regions remain dark. (A) Type 2 CNV in a ball-of-wool-shaped pattern and a surrounding halo. (B) Type 2 CNV, but with larger neovascularization which is coral-shaped. A dark halo can be observed around some parts of the neovascularization. The software displays numerical data about the flow in the selected region, important for quantitative comparison and for monitoring the treatment response. In the lower part of image, OCT B-scans are presented showing the depth of analyzed layers.
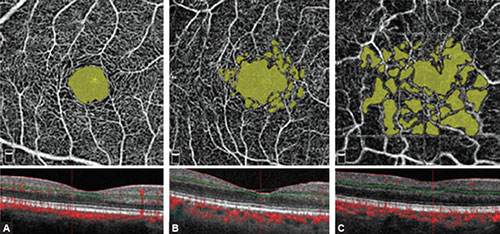
Figs. 1.12A to C: AngioAnalytics of nonflow regions in the superficial retinal layer of a healthy eye, nonproliferative diabetic retinopathy eye, and ischemic diabetic retinopathy eye. By analyzing nonflow area, the software shows all the regions of vascular dropout in yellow by mouse click selection. (A) Central region of the foveal avascular zone (FAZ) demarcated in yellow is visualized in the healthy eye. The software automatically shows numeric data of the FAZ and nonflow area size. In this example, FAZ measures 0.352 mm2 representing a physiological value. Enlarged perifoveal intercapillary areas and vascular defects are not visualized. A regular, symmetric, and dense superficial vascular network is seen. (B) In the eye with nonproliferative diabetic retinopathy, the FAZ and perifoveal intercapillary area (vascular dropout) appear enlarged and slightly irregular with numerous microaneurysms (not relevant for this analysis). Nonflow area in this example measures 0.797 mm2, a value higher than the physiological one. (C) The eye with ischemic diabetic retinopathy shows yellow zones of different size that present the regions of vascular dropout. The regular oval FAZ is not seen, so the surface of the selected nonflow regions is 1.620 mm2.
The operator may choose the region of interest and manually color suspicious areas which are automatically colored in yellow by software if they are ischemic. Software can also calculate the size of ischemic nonflow regions. These data are automatically saved for further monitoring and comparison (Figs. 1.12A to C).
Flow Density Map
This type of AngioAnalytics has recently been available and designed for separating flow and nonflow regions on one map.9
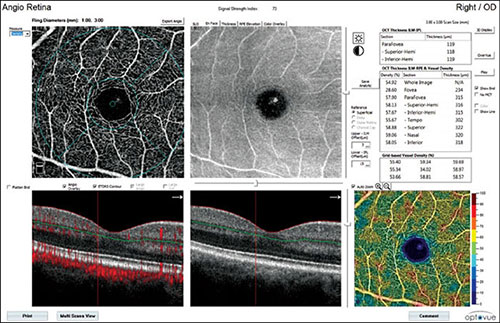
Fig. 1.13: Flow density map of the superficial vascular layer in a healthy eye. Central angiography shows normal superficial vascular network, corresponding en face optical coherence tomography angiography (OCT) image, and OCT-B scan in the lower part showing the localization of the analyzed superficial layer of the inner retina. In the lower right corner of the Figure, flow density map illustrates prevailing yellow-orange areas that indicate regions with vascular flow. A normal, blue avascular foveal avascular zone is in the central zone. The chart in the upper-right part of the Figure shows numeric values of flow density in segments, expressed as percentage.
It automatically calculates numerically the percentage of flow and nonflow region, or a color-coded scale can be used. The scale shows the results in cool and warm colors with cool blue areas corresponding to the areas of weak and reduced flow, while warm yellow-orange areas indicate areas of medium-high flow density. Flow density map also estimates segmented vascularization density, expressed as the percentage on en face angiogram. This analysis provides information on mean capillary network density in each macular and paramacular sector. The calculation of capillary network density may be applied for both the superficial and deep vascular plexus. This application of AngioAnalytics is used in all vascular occlusive disorders, in monitoring diabetic retinopathy, and in estimating regression changes after laser photocoagulation and/or anti-VEGF treatment (Figs. 1.13 and 1.14).
OCTA COMPARISON TO FLUORESCEIN AND INDOCYANINE GREEN ANGIOGRAPHY
Fluorescein angiography and indocyanine green angiography (FAG and ICG) have been the gold standards of retinal vascular imaging until recently. Compared to these two methods, a newly developed method, OCTA has many advantages and differences. SSADA protocol is a noninvasive method, does not require patient's preparation nor intravenous contrast dye, it is fast, and images can be acquired in a few minutes. FAG and ICG are methods requiring intravenous injections that can result in many side effects such as nausea, vomiting, and rarely anaphylaxis.10
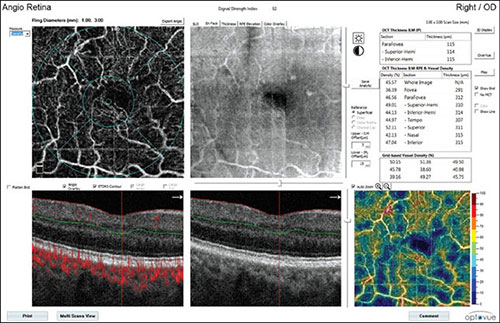
Fig. 1.14: Flow density map of the superficial vascular layer of an eye with ischemic diabetic retinopathy. The center of angiography illustrates superficial vascular network with the foveal avascular zone without margins, enlarged intercapillary nonflow spaces, and thin irregular blood capillaries. A corresponding en face optical coherence tomography angiography (OCT) is also illustrated; OCT B-scan in the lower part shows the localization of the analyzed superficial layer of the inner retina. Flow density map (lower right) illustrates cool blue regions indicating the areas with low or completely reduced flow. Few regions are in warm colors, they are mostly pale and indicate progressive attenuation of vascularization in this layer. The chart (upper-right) shows numeric values of flow density in segments, expressed as percentage.
The noninvasive nature of OCTA allows more frequent and better follow-up and monitoring of the therapeutic response. Dye leakage in FAG is a vital sign in recognizing vascular pathologies such as neovascularization or microaneurysms. It is important to note that OCTA cannot show leakage because it does not employ a dye; vascular pathologies are detected by the other methods based on depths and vascular abnormality pattern. Choroidal neovascularizations (CNVs) are illustrated as clear vascular models present above the RPE (type 2 CNV), or between the Bruch's membrane and the RPE (type 1 CNV). OCTA measures and analyzes the regions of capillary dropout and neovascularizations as well as the regions with high flow with more precision because there is no dye leakage and image staining as in FAG.
SUGGESTED READING
- Campbell JP, Zhang M, Hwang TS, et al. Detailed vascular anatomy of the human retina by projection-resolved optical coherence tomography angiography. Sci Rep. 2017;7:42201.
- Chalam KV, Sambhav K. Optical coherence tomography angiography in retinal diseases. J Ophthalmic Vis Res. 2016;11(1):84–92.
- Chen CL, Wang RK. Optical coherence tomography based angiography [invited]. Biomed Opt Express. 2017;8(2):1056–82.
- Coscas G, Lupidi M, Coscas F. Heidelberg spectralis optical coherence tomography angiography: technical aspects. Dev Ophthalmol. 2016;56:1–5.
- Coscas G, Lupidi M, Coscas F. Image analysis of optical coherence tomography angiography. Dev Ophthalmol. 2016;56:30–6.
- Fang PP, Lindner M, Steinberg JS, et al. Clinical applications of OCT angiography. Ophthalmologe. 2016;113(1):14–22.
- Gao SS, Jia Y, Zhang M, et al. Optical coherence tomography angiography. Invest Ophthalmol Vis Sci. 2016;57(9):27–36.
- Hoon M, Okawa H, Della Santina L, et al. Functional architecture of the retina: development and disease. Prog Retin Eye Res. 2014;42:44–84.
- Jayadev C, Jain N, Sachdev S, et al. Utility of noninvasive imaging modalities in a retina practice. Indian J Ophthalmol. 2016;64(12):940–43.
- Jia Y, Bailey ST, Hwang TS, et al. Quantitative optical coherence tomography angiography of vascular abnormalities in the living human eye. Proc Natl Acad Sci U S A. 2015;112(18):E2395–402.
- Lumbroso B, Huang D, Chen JC, et al. Clinical OCT angiography atlas, 1st edition. New Delhi: Jaypee Brothers Medical Publishers; 2015. pp. 1–20.
- Lumbroso B, Huang D, Souied E, et al. Practical handbook of OCT angiography, 1st edition. New Delhi: Jaypee Brothers Medical Publishers; 2016. pp. 1–21.
- Shoughy SS, Kozak I. Selective and complementary use of optical coherence tomography and fluorescein angiography in retinal practice. Eye Vis (Lond). 2016;3:26.
- Son T, Wang B, Thapa D, et al. Optical coherence tomography angiography of stimulus evoked hemodynamic responses in individual retinal layers. Biomed Opt Express. 2016;7(8):3151–162.
- Spaide RF, Curcio CA. Evaluation of segmentation of the superficial and deep vascular layers of the retina by optical coherence tomography angiography instruments in normal eyes. JAMA Ophthalmol. 2017;135(3):259–62.
- Wylęgała A, Teper S, Dobrowolski D, et al. Optical coherence angiography: a review. Medicine (Baltimore). 2016;95(41):e4907.
- Zhang A, Zhang Q, Chen CL, et al. Methods and algorithms for optical coherence tomography-based angiography: a review and comparison. J Biomed Opt. 2015;20(10):100901.